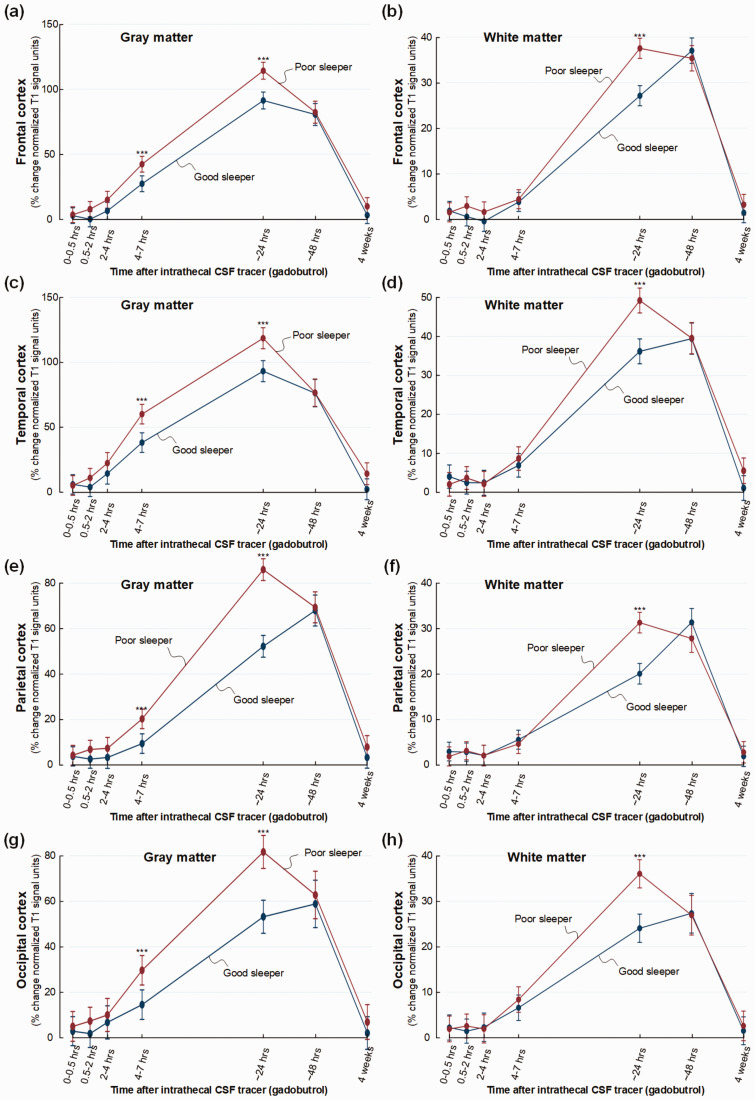
Figure 5.
Trend plots illustrating CSF tracer enrichment in the four brain lobes of iNPH patients with good or poor sleep quality. For patient cohort #2 with the dementia subtype iNPH, trend plots of percentage change in normalized T1 signal units from baseline, indicative of extra-vascular cerebral tracer enrichment are presented for (a) gray matter of frontal cortex, (b) white matter of frontal cortex, (c) gray matter of temporal cortex, (d) white matter within temporal cortex, (e) gray matter of parietal cortex, (f) white matter within parietal cortex, (g) gray matter of occipital cortex, and (h) white matter within occipital cortex. Significant differences between the Poor sleepers (red line) and Good sleepers (blue line) are indicated as follows: *P < 0.05, **P < 0.01, ***P < 0.001. Trend plots show mean with error bars (95% confidence intervals) from linear mixed models.

