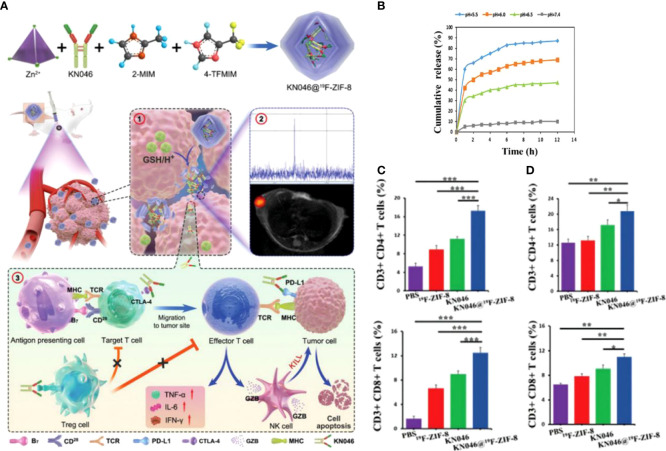
Figure 6.
(A). Schematic diagram of the structural composition of KN046@19F-ZIF-8 nanoplatform and ① Schematic diagram of KN046@19F-ZIF-8 in response to tumor microenvironment and dissolution of release. ② 19F NMR signals response to GSH/H+. ③KN046@19F-ZIF-8 combined with dual-targeted immune checkpoint inhibitors for anti-tumor immunotherapy. (B) cumulative release of KN046 from KN046@19F-ZIF-8 in PBS at different pH (pH =5.0, 6.0, 6.5, 7.4). (C, D) The number of CD4+T and CD8+T cells in the tumor and spleen was measured and quantified by flow cytometry after treatment with different treatment regimens (PBS, 19F-ZIF-8, KN046, KN046@19F-ZIF-8) for the tumor-bearing mice. Data are expressed as mean ± SD (n = 5, *p < 0.05, **p < 0.01,***p < 0.001) (128). Reprinted with permission from Ref. (128).

