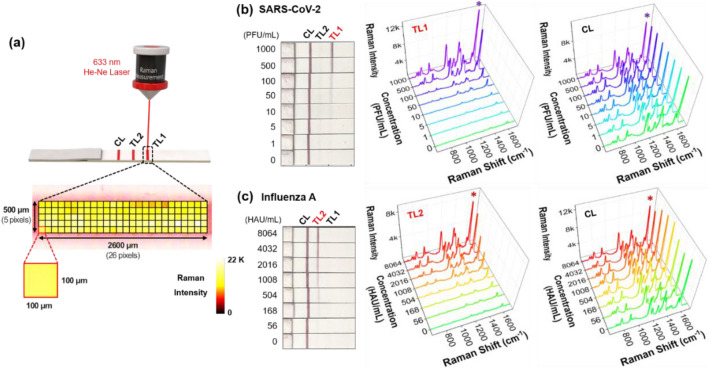
Fig. 3.
a Pixel-to-pixel SERS detections for an area of 2600 μm × 500 μm with a 100 μm interval for test and control lines. Raman signal intensities for 130 spots were averaged to obtain reliable Raman signal intensity. b Visual color changes of the SERS-LFA strip and corresponding SERS spectra of the test and control lines when the concentration of SARS-CoV-2 lysate changed in the range of 0–1000 PFU/mL. c Visual color changes of the SERS-LFA strip and corresponding SERS spectra of the test and control lines when the concentration of influenza A virus lysate changed in the range of 0–8064 HAU/mL

