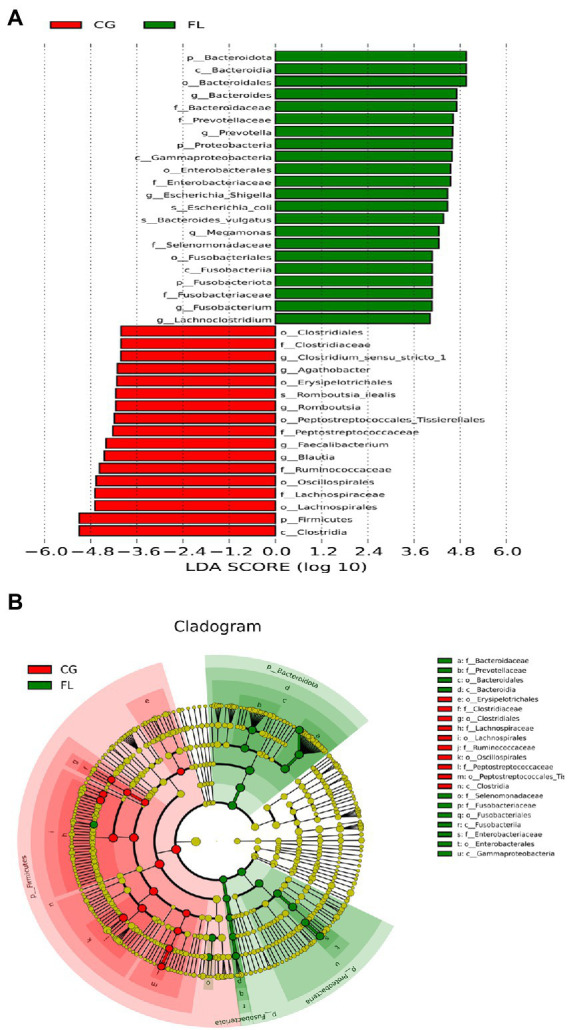
Figure 2.

Linear discriminant analysis (LDA) effect size analysis. (A) Histogram of the LDA scores for different abundant taxa. Green, enriched in MAFLD patients; red, enriched in CG. (B) Cladogram of LEfSe linear discriminant analysis. Red and green circles represent the differences of the most abundant microbiome class. The diameter of each circle is proportional to the relative abundance of the taxon.
