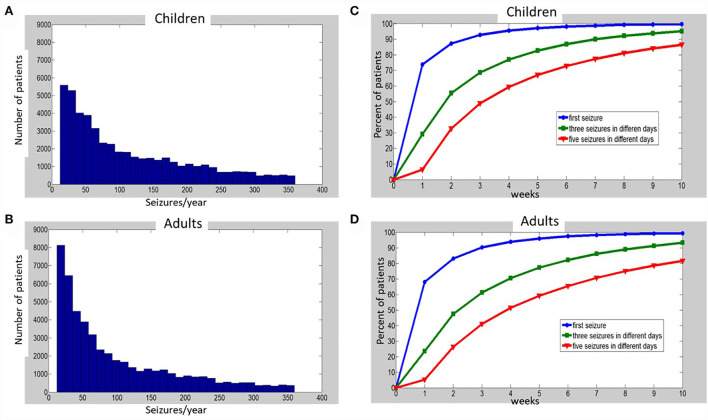
Figure 1.
Histograms of simulated annual seizure frequencies distribution among 50,000 children (A) and 50,000 adults (B) with epilepsy, and percentages of patients (C—children, D—adults), for which one (blue), three (green), or five (red) seizures on different days were captured at the end of each week, up to 10 weeks of monitoring. See Supplementary material for details of simulations and Supplementary Tables S1, S2 for the raw data that were used to build the charts (C,D).

