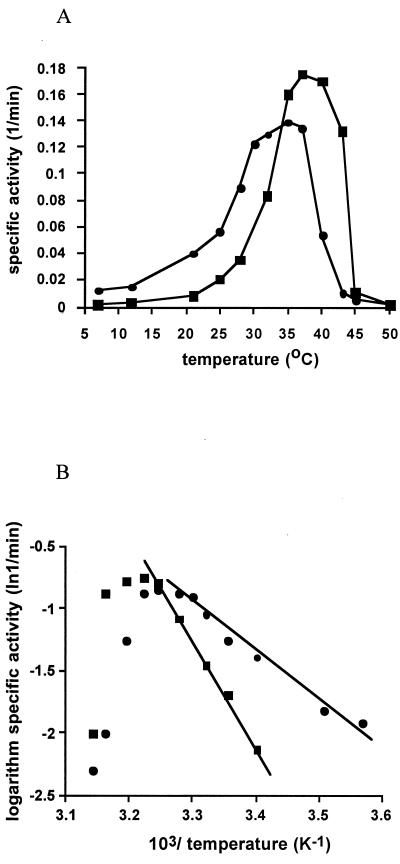
FIG. 4.
(A) Specific activity of the GTP hydrolysis for M. burtonii EF-2 (circles) and M. thermophila EF-2 (squares) versus temperature. (B) Arrhenius plot showing the logarithm of GTP hydrolysis for M. burtonii EF-2 (circles) and M. thermophila EF-2 (squares) versus the reciprocal of the absolute temperature. Lines represent the regression of the linear range used to determine the activation energy of catalysis (for values, see the text). Activity was measured in the presence of 10% propanol and 10 mM BaCl2.

