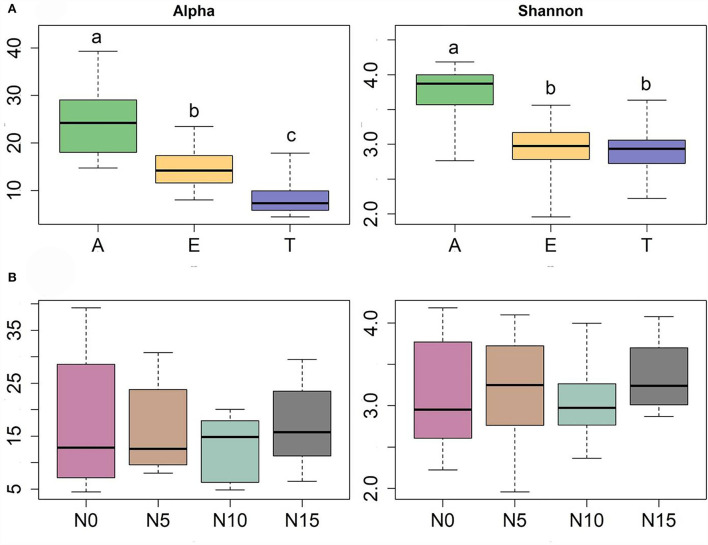
Figure 2.
Diversity patterns of the entire fungal community of three species against host (A) and N gradients (B) based on linear models. Alpha is the number of observed species, and Shannon is the Shannon diversity index. The sequences were rarified to 1,944, n = 71. Significant differences of each variable are indicated by dissimilar letters above boxes. A, Anemone rivularis; E, Elymus nutans; T, Thermopsis lanceolata. N0, N5, N10, and N15 referring to 0, 5, 10, and 15 g N (NH4NO3) m−2 yr−1 treatments, respectively.

