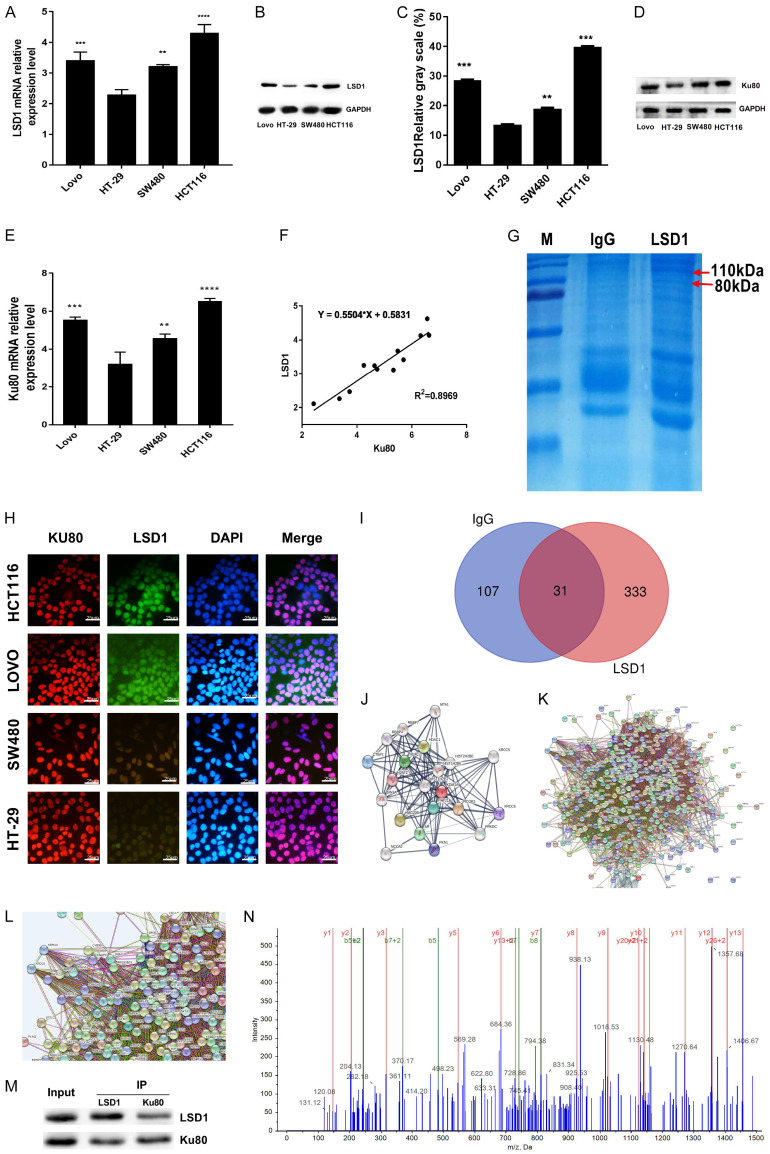
Figure 1.
Ku80 and LSD1 interact in colon cancer cells. LSD1 mRNA levels in the indicated cell lines were measured by RT-qPCR (A). The data were normalized to the expression of the housekeeping gene glyceraldehyde 3-phosphate dehydrogenase (GAPDH). (B) The protein expression of LSD1 in the indicated cells was detected by immunoblot. (C) LSD1 protein gray value statistics. The data were normalized to the expression of the housekeeping gene glyceraldehyde 3-phosphate dehydrogenase (GAPDH). (D) The protein expression of Ku80 in the indicated cells was detected by immunoblot. (E) RT-qPCR measured ku80 mRNA levels in the indicated cell lines. (F) Linear correlation analysis of the expression relationship between Ku80 mRNA and LSD1 mRNA in indicated cells. (G) LSD1 monoclonal antibody was used for immunoprecipitation, and Coomassie brilliant blue staining was performed after gel electrophoresis; Compared with the IgG group, there are obvious bands at 80 kda and 110 kda. (H) LSD1 and Ku80 immunofluorescence subcellular localization in 4 colon cancer cells. (I) Venn diagram of different protein sets between experimental samples, experimental group (exclusive to LSD1) 333. (J-L) Visualize the interaction network between proteins; it can be seen that Ku80 interacts with LSD1. (M) Immunoprecipitation to detect the interaction of Ku80 and LSD1. (N) Mass-to-charge ratio diagram of Ku80 protein identified by mass spectrometry. Three independent assays were performed in triplicate. The data were expressed as mean ± SD. **P<0.01, ***P<0.001.

