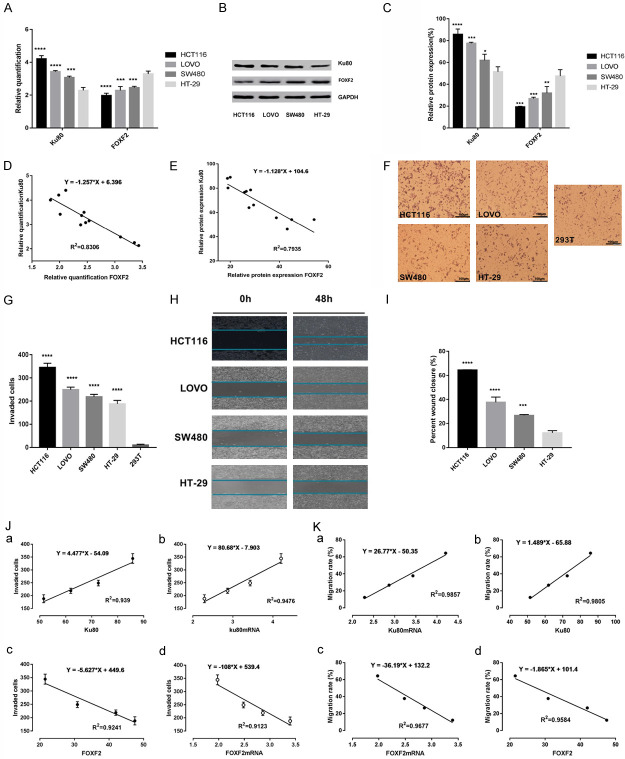
Figure 2.
Correlation of LSD1, FOXF2 and Ku80 with the invasiveness of colon cancer cell lines. A. RT-qPCR measured ku80, FOXF2 mRNA levels in the indicated cell lines. The data were normalized to the expression of the housekeeping gene glyceraldehyde 3-phosphate dehydrogenase (GAPDH). B. The protein expression of Ku80 and FOXF2 in the indicated cells was detected by immunoblot. C. Ku80, FOXF2 protein gray value statistics. The data were normalized to the expression of the housekeeping gene glyceraldehyde 3-phosphate dehydrogenase (GAPDH). D. Analyzing the correlation between Ku80 and FOXF2 mRNA in the indicated cells was detected by Pearson linear correlation statistics. E. Analyzing the correlation between Ku80 and FOXF2 protein in the indicated cells was detected by Pearson linear correlation statistics. F. Matrigel assay in colon cancer cell lines (HCT116, SW480, LOVO, HT-29) and 293T cell line (magnification, ×100). G. Statistics of the number of cells crossing matrigel in indicated cells. H. Scratch assay to detect the migration distance of 4 colon cancer cell lines at 0 h and 48 h. I. Statistics of the percentage of wound healing in the indicated four cell lines. J. The correlation between the expression levels of Ku80 and FOXF2 with the invasiveness of 4 indicated cells was analyzed by Pearson. K. The correlation between the expression levels of Ku80 and FOXF2 with the migrations of 4 indicated cells was analyzed by Pearson. Three independent assays were performed in triplicate. The data were expressed as mean ± SD. **P<0.01, ***P<0.001.

