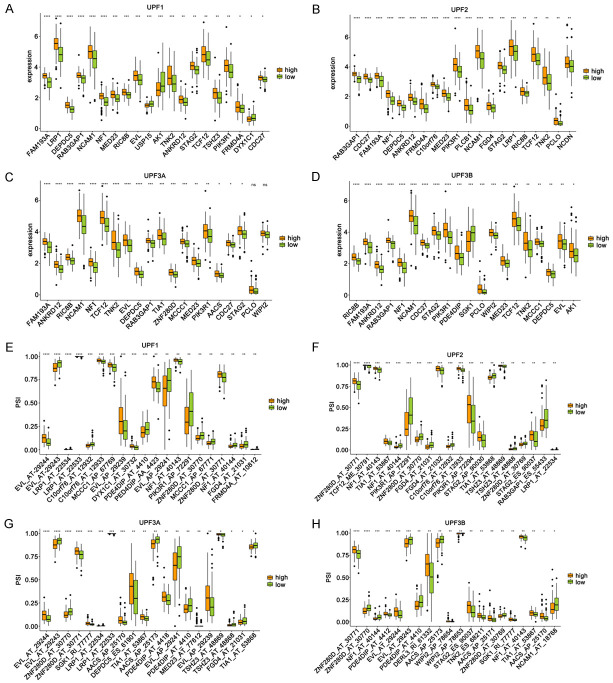
Figure 5.
Relationship between NMD factors and potential antigen candidate genes. A-D. The top 20 most significantly differentially expressed genes in the high-expression and low-expression groups. E-H. The top 20 most significant differences in the distribution of splicing events in the high-expression and low-expression groups. *P ≤ 0.05, **P ≤ 0.01, ***P ≤ 0.001.

