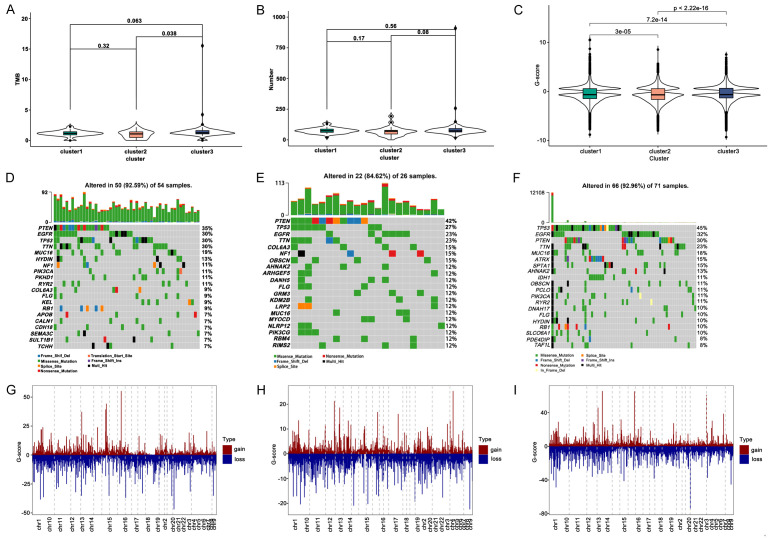
Figure 8.
Mutation and CNV analysis between immune subtypes. A. Distribution of TMB score in immune subtypes. B. Number of mutation genes in immune subtypes. C. G-score of three immune subtype. D-F. Waterfall diagram of mutation genes in cluster1, cluster2, and cluster3. G-I. Distribution of copy number on chromosomes in cluster1, cluster2, and cluster3.

