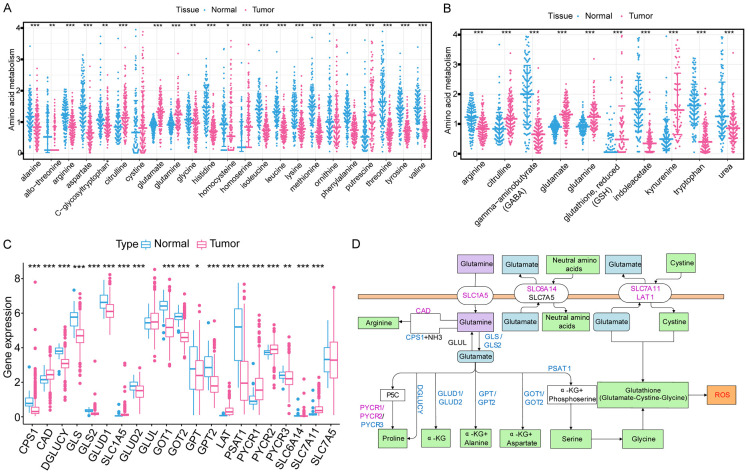
Figure 1.
Differentially expressed amino acids, related metabolites, and glutamine metabolic genes (GMGs) between normal kidney and ccRCC tissues. A. Expression profiles of amino acids in ccRCC and normal tissues. B. Expression profiles of amino acid metabolites in ccRCC and normal tissues. C. Expression profiles of GMGs in ccRCC and normal tissues. Red, tumor; Blue, normal. The upper and lower ends of the boxes represent the interquartile range of values. The lines in the boxes represent the median values. Adjusted P<0.05 was used as the criteria for screening differentially expressed GMGs. The asterisks represent the statistical P value (*P<0.05, **P<0.01, ***P<0.001). D. The flow chart of glutamine metabolism. Red, up-regulated genes; blue, down-regulated genes.

