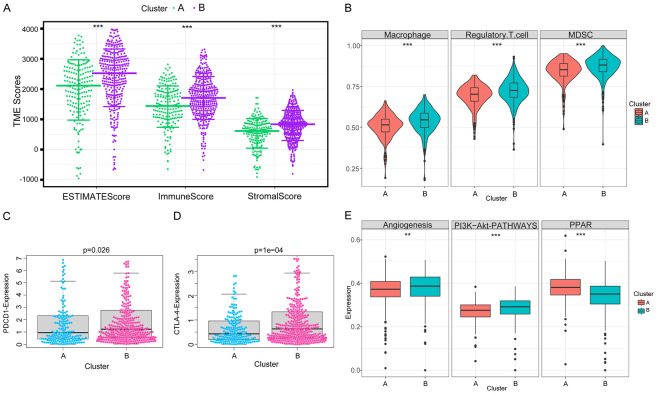
Figure 3.
Immune-related TME characteristics in two clusters of distinct glutamine metabolic patterns. A. Samples in cluster B exhibited higher ESTIMATE, stromal, and immune scores than cluster A. B. Abundances of main immunosuppressive infiltrating cells in TME in two clusters. Cluster B was classified as the immunosuppressive phenotype, characterized by the suppression of immunity. C, D. Difference in the expression of PDCD1 and CTLA-4, two common immune checkpoint molecules, between clusters A and B (PDCD1, P = 0.026; CTLA-4, P = 0.0001). E. Differences in tumor-related pathways, including angiogenesis, PI3K-Akt, and PPAR signaling pathways between two clusters. Wilcox test was used, and the asterisks represent the statistical P value (*P<0.05, **P<0.01, ***P<0.001).

