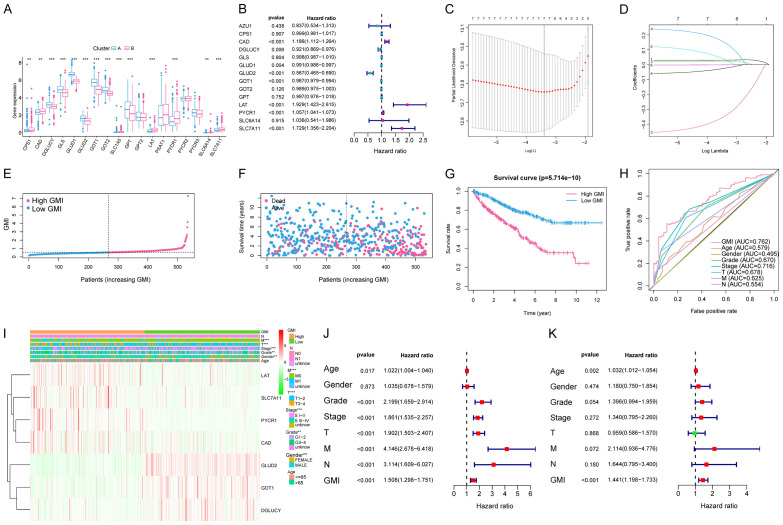
Figure 4.
Construction of the GMI model and relationships between the GMI, clinicopathological features and glutamine metabolic patterns. A. 14 GMGs were identified between two clusters. Adjusted P<0.05 was used as the criteria for screening differentially expressed GMGs. The asterisks represent the statistical p value (*P<0.05, **P<0.01, ***P<0.001). B. Eight prognostic genes were selected by the univariate Cox regression analysis. C, D. A 7-mRNA signature was constructed by the LASSO Cox regression. E, F. Prognostic analysis of the 7-gene signature in the TCGA cohort. The dotted line represents the median GMI, and divides the patients into low and high-GMI groups. A higher mortality was correlated to a higher GMI according to the curve of GMI and survival status of the patients. G. Kaplan-Meier survival analysis of the whole ccRCC set from the TCGA. The survival rate of the patients in the high-GMI group was significantly lower than that in the low-GMI group (P = 5.714e-10). H. Time-dependent ROC analysis of the whole ccRCC set from the TCGA. The area under the 5-year ROC curve was 0.762, which was higher than those of current clinical predictive factors. I. Differences in representative gene expression profiles and clinicopathological characteristics between the low and high-GMI groups. J, K. Univariate and multivariate Cox regression analyses of clinicopathological features for predicting the survival in ccRCC patients.

