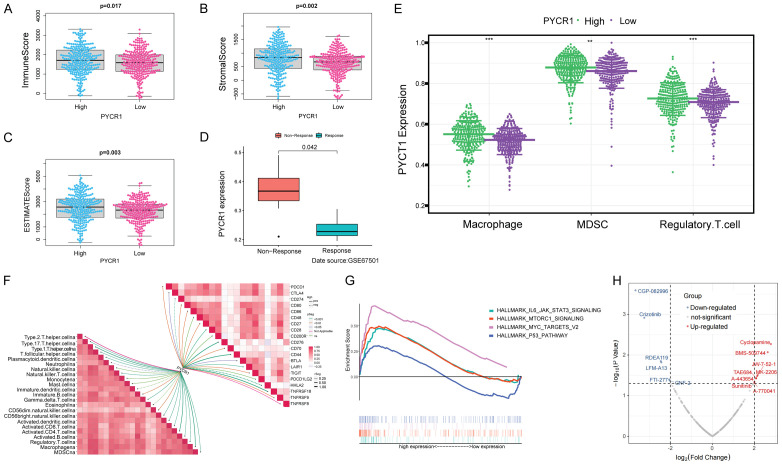
Figure 6.
PYCR1 was associated with the immunity in the TME of ccRCC. A-C. Difference analysis of ImmuneScore, StromalScore, and ESTIMATEScore between the high and low-PYCR1-expression subgroups. High PYCR1 expression corresponded to high ImmuneScore (P = 0.017), StromalScore (P = 0.002), and ESTIMATEScore (P = 0.003). D. Correlation of PYCR1 expression with the response to immunotherapy (data source: GSE67501). PYCR1 expression level was significantly higher in ccRCC patients showing no response to immunotherapy (P = 0.042). E. Higher PYCR1 expression was accompanied by higher-degree infiltration of immunosuppressive cells. Wilcox test was used, and the asterisks represent the statistical P value (*P<0.05, **P<0.01, ***P<0.001). F. Correlation analysis of PYCR1 expression with TME cell infiltration and the levels of immune checkpoint molecules. PYCR1 expression was positively correlated with the levels of many immunosuppressive factors, such as MDSC, macrophage, Tregs, PDCD1, and CTLA-4. G. GSEA analysis of hallmarks in the high and low-PYCR1-expression subgroups. The MYC-TARGRTS, MTORC1, and IL6-JAK-STAT3 signaling pathways were up-regulated in high-PYCR1-expression subgroups, all known as oncogenic pathways. H. Correlation analysis of PYCR1 expression and drug sensitivity. PYCR1 was positively correlated with IC50 in 8 drugs and negatively in 6 drugs.

