Figure 4.
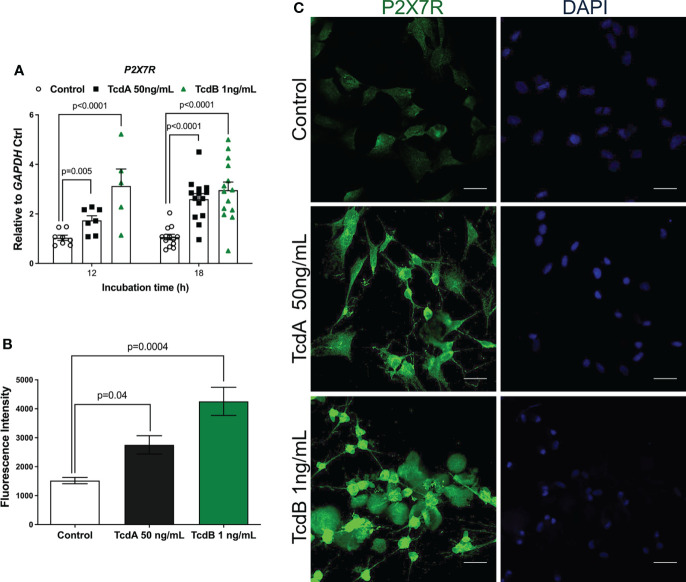
TcdA and TcdB upregulate P2X7R expression in EGCs. (A) Gene expression of P2X7R were evaluated by qPCR in EGCs incubated with DMEM only (control), TcdA (50 ng/mL) and TcdB (1 ng/mL). The data are the mean ± SEM. Two-way ANOVA followed by the Tukey test was used. (B) Fluorescence intensity of P2X7R immunostaining in EGCs measured by ImageJ software. The data are the mean ± SEM. One-way ANOVA followed by the Tukey test was used. p value is represented in the graph (C) Representative photomicrographs of P2X7R (green) immunostaining and DAPI (blue) nuclear staining in EGCs exposed to TcdA and TcdB after 18 h of incubation.

