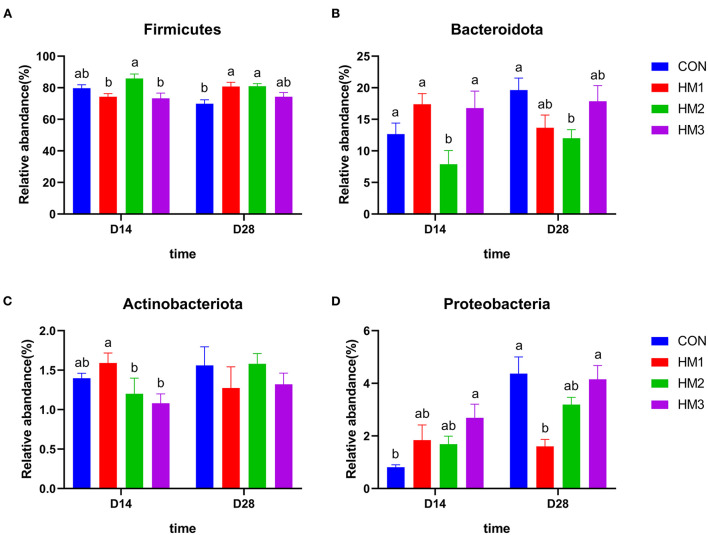
Figure 3.
Comparison of dominant intestinal microbiota at phylum level. Relative abundances of Firmicutes (A), Bacteroidetes (B), Actinobacteria (C), and Proteobacteria (D) among the four groups on d 18 and d 35. CON, basic diet; HM1, basic diet with 0.5 g/kg of herbal mixture; HM2, basic diet with 1.0 g/kg of herbal mixture; HM3, basic diet with 1.5 g/kg of herbal mixture. Different lowercase letters in the figure indicate statistically significant differences (p < 0.05).

