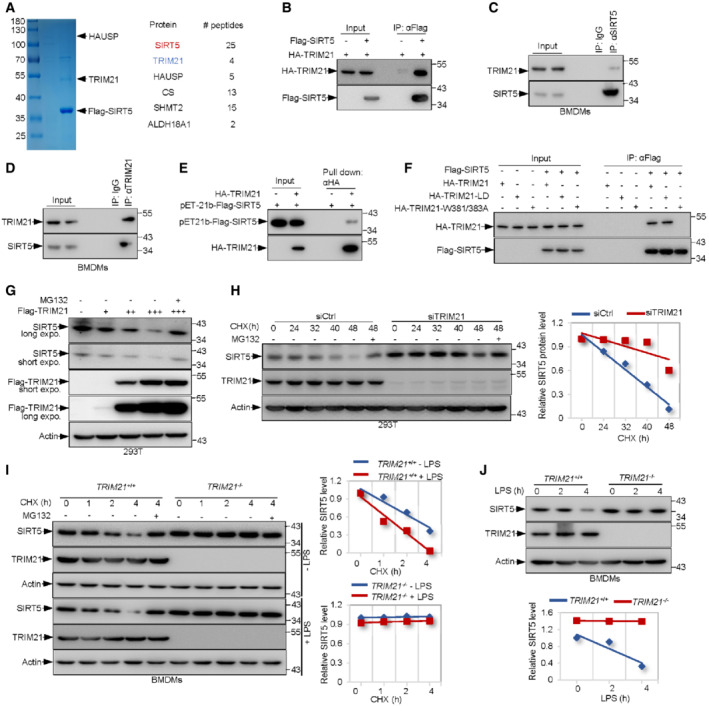
Figure 1. TRIM21 directly binds to SIRT5 and promotes its degradation.

-
AMass spectrometry (MS) assay of indicated electrophoretic bands in Coomassie blue staining (left panel), and proteins pulled down by Flag‐tagged SIRT5 from 293T cells were indicated on the right.
-
BLysates from 293T cells transfected with HA‐TRIM21 and Flag‐SIRT5 or vector control (−) as indicated were immunoprecipitated (IP) using anti‐Flag antibody, and bound proteins were analyzed by Western blotting (WB).
-
C, DLysates from BMDMs were immunoprecipitated with anti‐SIRT5 (C), anti‐TRIM21 (D) or control IgG antibodies as indicated and then analyzed by Western blotting.
-
EBacterially expressed and purified Flag‐SIRT5 were incubated with purified HA‐TRIM21 proteins prior to pull down with anti‐HA antibody followed by Western blot analysis.
-
FImmunoblot (IB) analysis of whole‐cell lysates (WCLs) and immunoprecipitates (IPs) derived from 293T cells transfected with Flag‐SIRT5 together with HA‐TRIM21 or indicated HA‐tagged mutant TRIM21 constructs. Cells were treated with 10 μM MG132 for 4 h before harvesting. HA, hemagglutinin.
-
GIB analysis of WCLs derived from 293T cells transfected with increasing amounts of Flag‐TRIM21 construct. Where indicated, 10 μM MG132 was added for 4 h before harvesting.
-
H293T cells transfected with control or TRIM21 siRNA for 48 h were then treated with 100 ng/ml CHX for the indicated time period before harvesting. Protein expression was analyzed by Western blotting (left panel). The SIRT5 protein abundance was quantified by ImageJ and plotted as indicated (right panel).
-
IIB analysis of WCLs derived from TRIM21 +/+ and TRIM21 −/− BMDMs treated with 100 ng/ml CHX for the indicated time period before harvesting (left panel). The SIRT5 protein abundance was quantified (right panel).
-
JIB analysis of WCLs derived from TRIM21 +/+ and TRIM21 −/− BMDMs treated with 100 ng/ml LPS for the indicated time period before harvesting (top panel). The SIRT5 protein abundance was quantified (bottom panel).
Data information: All IP and WB data in this work otherwise indicated are representative of at least three independent experiments.
