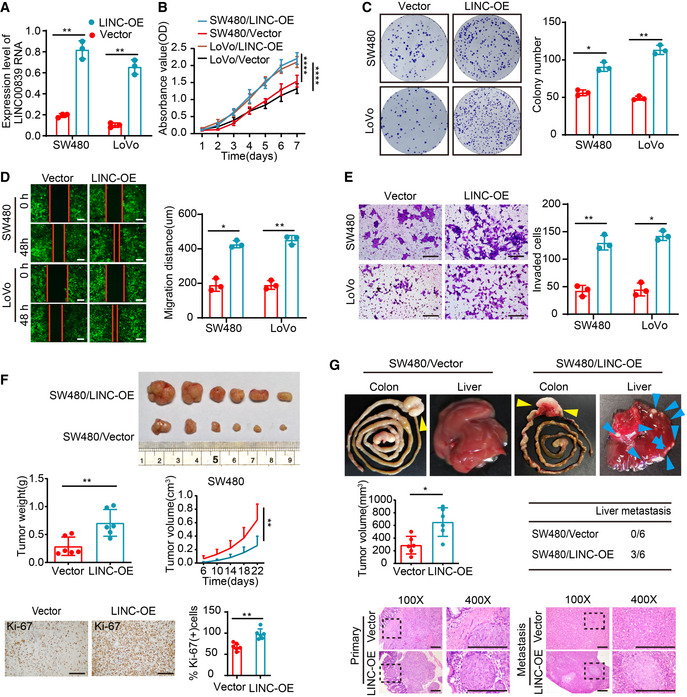
Figure 2. Overexpression of LINC00839 promotes CRC cell growth and metastasis in vitro and in vivo .

-
AOverexpression of LINC00839 in SW480 and LoVo cells was confirmed by qPCR (mean ± SD, Student's t‐test, n = 3 technical replicates).
-
BThe proliferation of LINC00839‐overexpressing cells was determined by CCK8 assay (mean ± SD, ANOVA, n = 3 biological replicates).
-
CColony formation assay was performed with LINC00839‐overexpressing cells and vector control cells.
-
DWound‐healing assay was performed with LINC00839‐overexpressing cells and vector control cells. Scale bars, 100 μm.
-
EMatrigel invasion assay was performed with LINC00839‐overexpressing cells. Scale bars, 100 μm.
-
FThe CDX model showing the effect of LINC00839 on tumor growth. Representative image of tumors harvested from the mouse model (upper panel), the quantitative analysis of tumor weight and tumor volume (medium panel), and representative images and quantification of IHC staining of Ki‐67 in tumors (bottom panel; n = 6 for each cohort, and the results are presented as the mean ± SD, Student's t‐test (medium left and low right panel) and ANOVA (medium right). Scale bars, 100 μm (n = 6 biological replicates).
-
GThe CRC orthotopic mouse model revealed the effect of LINC00839 on tumor development. Representative images of primary tumors (yellow arrowheads) and liver metastasis (blue arrowheads) in the model (upper panel), analysis of tumor volume and the number of mice with liver metastasis (medium panel), and H&E staining of tumors and metastases (n = 6 for each cohort). Scale bars, 100 μm (n = 6 biological replicates).
Data information: In (C–E), the data are presented as the mean ± SD and were analyzed by Student's t‐test, n = 3 biological replicates. Across experiments, the P‐values are as follows: ns = not significant, *P < 0.05, **P < 0.01, ***P < 0.001, ****P < 0.0001.
