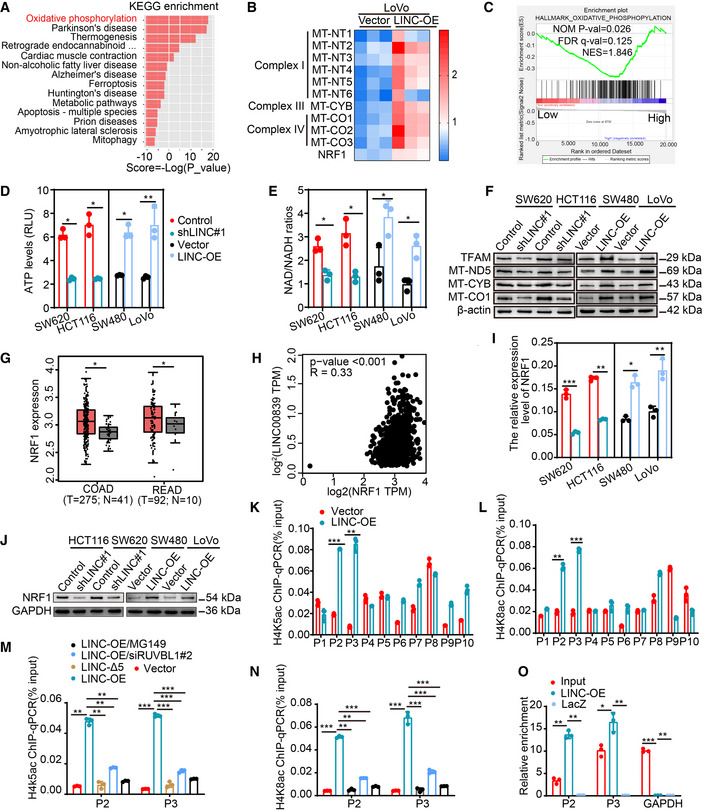
Figure 4. LINC00839 promotes NRF1‐mediated OXPHOS and mitochondrial biogenesis in CRC.

-
AKEGG pathway analysis of the DEGs identified by RNA‐seq.
-
BHeatmap of DEGs related to OXPHOS and mitochondrial biogenesis. Expression levels are shown in log2 scale of normalized intensity values (see color gradient) ranging from low (blue) to high (red) expression.
-
CGSEA of LINC00839 in the OXPHOS pathway (GSE14333).
-
D, EThe ATP levels and the NAD/NADH ratio were measured in LINC00839‐overexpressing and LINC00839‐KD cells (mean ± SD, Student's t‐test, n = 3 biological replicates).
-
FExpression of MT‐ND5, MT‐CYB, MT‐CO1, and TFAM in LINC00839‐overexpressing and LINC00839‐KD cells as determined by WB.
-
GAnalysis of NRF1 expression in CRC tissues (T) and normal tissues (N) in the GEPIA database.
-
HCorrelation analysis of LINC00839 and NRF1 mRNA levels in the TCGA and GTEx databases (Pearson).
-
I, JExpression of NRF1 in LINC00839‐overexpressing and LINC00839‐KD cells was measured by qPCR and WB.
-
K, LThe enrichment of the NRF1 promoter (P1‐P10) by H4K5ac and H4K8ac antibodies in LINC00839‐overexpressing and control LoVo cells as determined by CHIP assay. Normal IgG was used as a negative control.
-
M, NThe enrichment of the P2 and P3 fragments by H4K5ac and H4K8ac antibodies in LoVo cells as determined by CHIP assay. Normal IgG was used as a negative control.
-
OThe enrichment of NRF1 with a probe targeting LINC00839 relative to a NC probe in HCT116 cells, as determined by ChIRP assay. LacZ served as a negative control (NC).
Data information: In (I, K, L, M, N, and O), the data are presented as the mean ± SD and were analyzed by Student's t‐test, n = 3 technical replicates. In (G), the middle lines represent the median, and the upper and lower lines represent the upper and lower quartiles; the data were analyzed by ANOVA. Across experiments, the P‐values are as follows: ns = not significant, *P < 0.05, **P < 0.01, ***P < 0.001, ****P < 0.0001.
Source data are available online for this figure.
