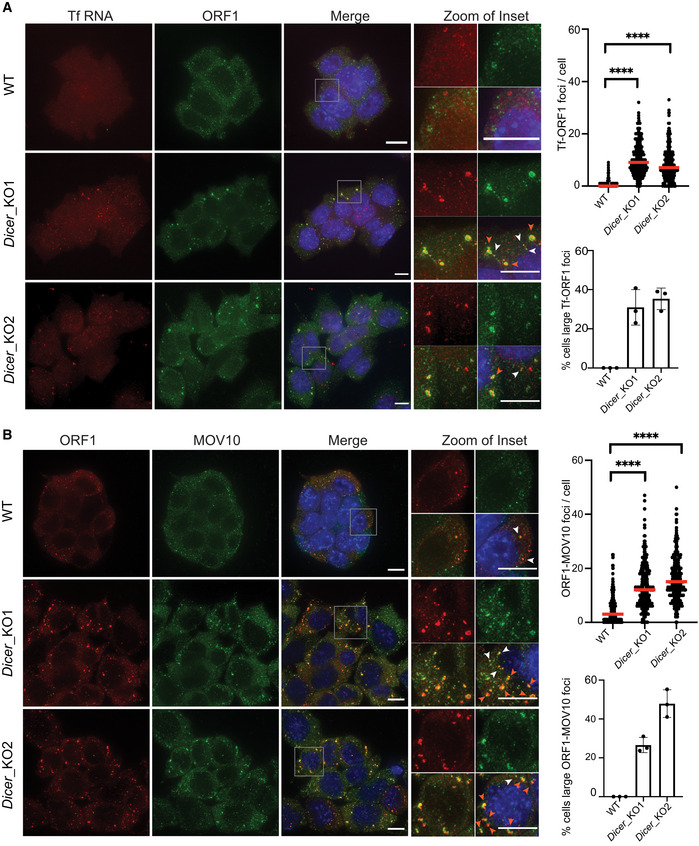
Figure 1. L1 RNPs accumulate as cytoplasmic foci in Dicer_KO mESCs.

-
AMaximum intensity projections across Z stacks of example images from indicated mESCs stained for L1 Tf RNA (red) combined with immunostaining for L1 ORF1p (green) and nuclei stained with DAPI (blue). The gray square marks position of the inset. White arrow heads point to cytoplasmic foci where L1 RNA and ORF1p co‐localize. Scatter plot shows the number of co‐localized L1 Tf‐ORF1 foci in the cytoplasm per cell (n = 275 WT, 304 Dicer_KO1, 311 Dicer_KO2 cells). Red arrow heads point to relatively larger sized L1 RNP foci. Bar graphs are mean values of percentage of cells with large L1 Tf‐ORF1 foci co‐localizing in the cytoplasm (n = 3 technical replicates).
-
BMaximum intensity projections across Z stacks of example images from indicated mESCs immunostained for L1 ORF1p (red), MOV10 (green) and nuclei stained with DAPI (blue). The gray square marks position of inset in the zoomed image. White arrow heads point to cytoplasmic foci where L1 ORF1p and MOV10 co‐localize. Scatter plot shows the number of co‐localized ORF1‐MOV10 foci in the cytoplasm per cell (n = 293 WT, 295 Dicer_KO1, 295 Dicer_KO2 cells). Red arrow heads point to relatively larger sized L1 ORF1‐MOV10 foci. Bar graphs are mean values of percentage of cells with large ORF1‐MOV10 foci co‐localizing in the cytoplasm (n = 3 technical replicates).
Data information: Data are depicted as scatter plots where circles are single data points representing number of co‐localized L1 Tf‐ORF1 foci in the cytoplasm per cell (A), or co‐localized L1 ORF1‐MOV10 foci in the cytoplasm per cell (B) red bar is median. Statistical analysis was performed using Mann–Whitney U test and ****P‐value < 0.0001. Bar graphs represent mean ± SD. Scale bar 5 μm.
Source data are available online for this figure.
