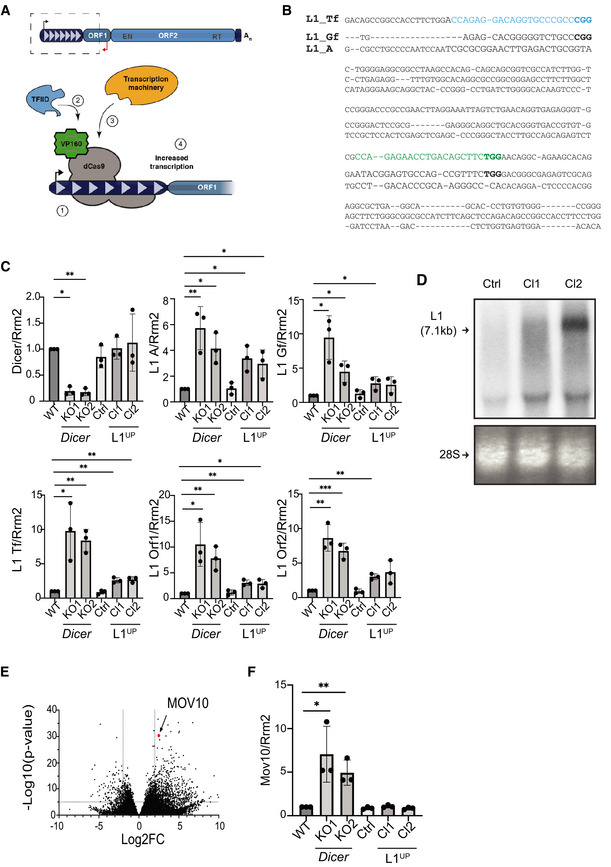
Figure EV2. Generation of mESCs upregulating L1 expression using CRISPRa.

-
ASchematic depicting full‐length L1 element and summary of CRISPRa. To generate L1UP cells, mESCs were co‐transfected with plasmid encoding catalytically dead Cas9 protein (dCas9) fused to VP160 and sgRNAs that (1) targeted the fusion protein to the 5'UTR sequence of Tf L1 family allowing (2) recruitment of transcription factors and (3) transcription machinery to (4) upregulate L1 transcription.
-
BSequence alignment of 5'UTR sequences of murine L1 Tf, Gf and A subfamilies. The two sgRNA sequences used to upregulate L1 expression are indicated in blue and green, with protospacer adjacent motifs (PAM) in bold.
-
CRT–qPCR analysis to quantitate Dicer, and L1 RNA expression levels in the depicted cell lines. Rrm2 was utilized for normalization, and graphs depict fold change in transcript levels compared to WT which was set to one (n = 3 technical replicates).
-
DRepresentative northern blot analysis probed for L1 RNA to assess L1 transcript length and expression levels in the engineered L1UP Cl1, Cl2 as compared with Ctrl cells. Arrow points to full‐length L1 transcript. Ethidium bromide staining of 28S RNA was used to confirm equal loading (n = 3 technical replicates).
-
EDifferential gene expression from RNA‐seq analysis of Dicer_KO vs. WT mESCs plotted using previously published data (Bodak et al, 2017).
-
FRT–qPCR analysis to confirm upregulation of Mov10 in Dicer_KO cells. Rrm2 was utilized for normalization, and graphs depict fold change in transcript levels in the indicated cell lines as compared to WT which was set to one (n = 3 technical replicates).
Data information: In (C and F) bar graphs are mean ± SD. P‐value computed using unpaired t‐test comparing results from individual cells to WT mESCs. ***P‐value < 0.0005, **P‐value < 0.001, *P‐value < 0.05. In (E) each dot represents a single gene. Position for Mov10 in the graph is marked. Values for Log2 fold change (Log2FC) were plotted on the x‐axis and Log10 of the P‐value on the y‐axis.
Source data are available online for this figure.
