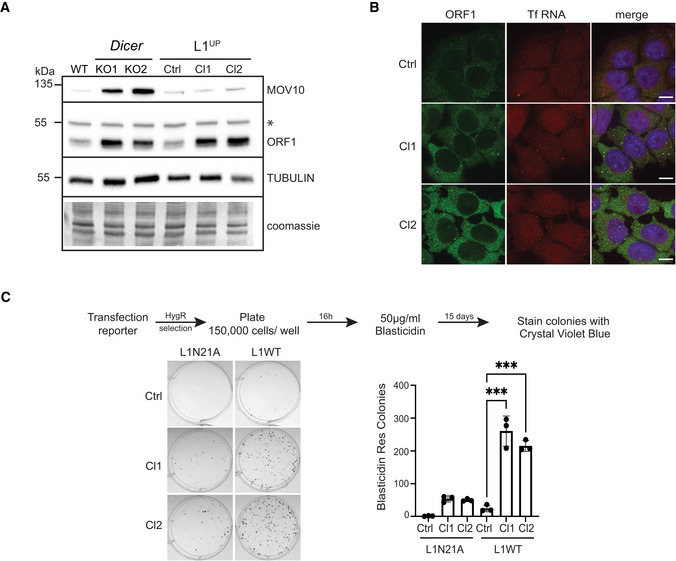
Figure 3. Endogenous L1 upregulation leads to increased L1 retrotransposition.

-
ARepresentative Western blots showing L1 ORF1p and MOV10 levels in the indicated cell lines. Immunoblot with antibody recognizing TUBULIN and coomassie stained membranes depict the loading, asterisk marks position of nonspecific band in the ORF1 immunoblot (n = 3 technical replicates).
-
BMaximum intensity projections across Z stacks of example images from indicated mESCs immunostained for L1 ORF1p (green) combined with RNA FISH for L1 Tf RNA (red) and nuclei stained with DAPI (blue) (n = 3 technical replicates). Scale bar 5 μm.
-
CRepresentative images of BlastR colonies stained with crystal violet blue of indicated cell lines is shown on the left. Cells were transfected with either mutant reporter plasmid (L1N21A) or retrotransposition competent reporter (L1WT) as shown in the scheme with timeline for the experiment on the top. Bar graphs on the right depict the average number of BlastR colonies (n = 3 biological replicates).
Data information: In (C) bar graphs represent mean ± SD, P‐value was determined using ordinary one‐way ANOVA test. ***Represent P‐value < 0.001.
Source data are available online for this figure.
