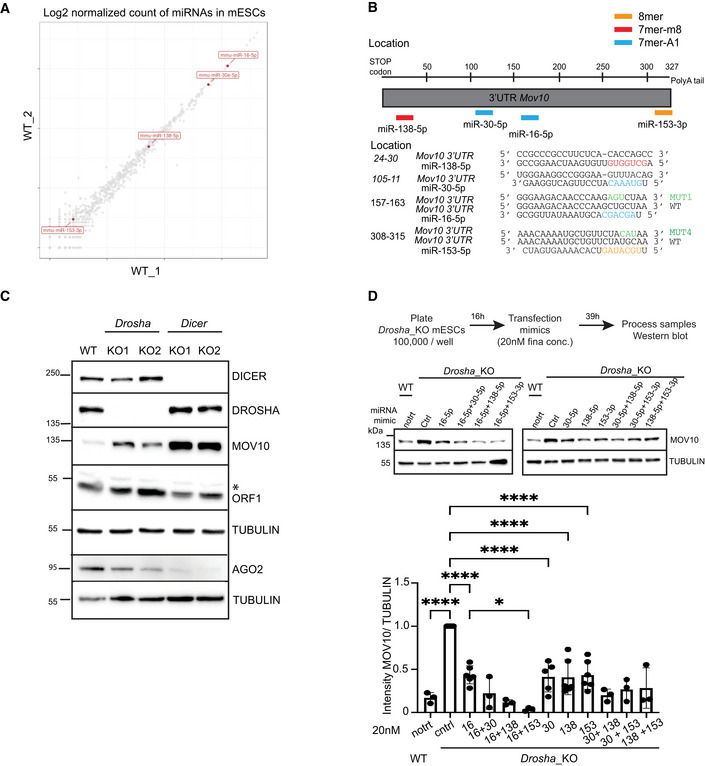
Figure EV3. Posttranscriptional regulation of Mov10 by miRNAs in mESCs.

- A
-
BSchematic of 3'UTR sequence of Mov10 RNA helicase. Location and sequence of WT and mutant (MUT) miRNA response elements (MREs) for mouse miR‐138‐5p (red), miR‐30‐5p (blue) miR‐16‐5p (blue) and miR‐153‐3p (orange) predicted to target Mov10 (ENSMUST00000168015.8) are color coded based on seed type matching for respective miRNAs.
-
CWestern Blot analysis to assess the expression of L1 ORF1p, MOV10, AGO2 in the indicated cell lines, immunoblot with TUBULIN served to control for loading. KO status was confirmed by probing for DROSHA and DICER (n = 3 technical replicates). Asterisk marks nonspecific band.
-
DSchematic depicting design of experiment for processing samples along with representative gels for WB analysis and quantitation of MOV10 and TUBULIN signals in Drosha_KO cells transfected with ctrl or mimic miRNA either singly or in pairs (n = 3–6 biological replicates). Untreated WT cells are shown for comparison of MOV10 expression.
Data information: Bar graphs are mean intensity ± SD of MOV10 normalized by TUBULIN. Values are relative to transfection for the Ctrl mimic that was set to 1. P‐values were computed using ordinary one‐way ANOVA test ****P‐value < 0.0001 and *P‐value < 0.05.
Source data are available online for this figure.
