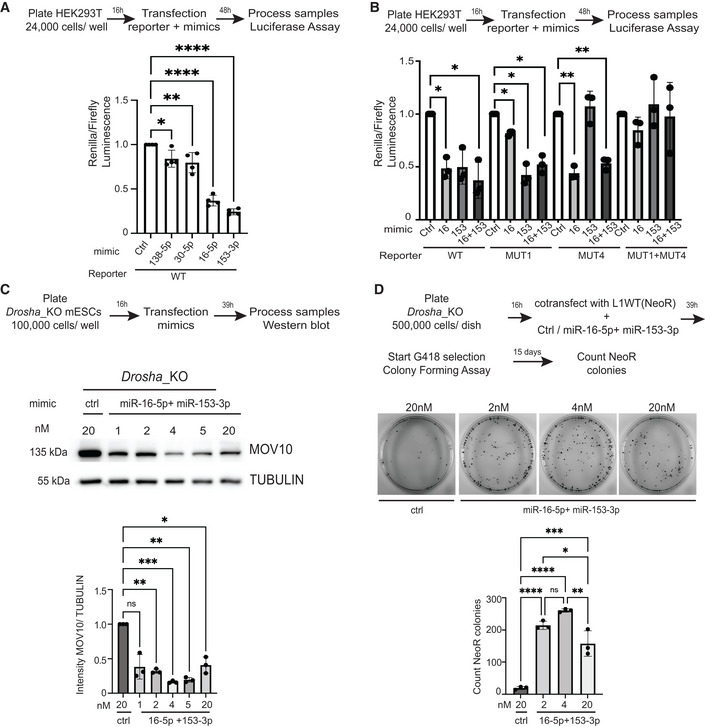
Figure 4. Multiple miRNAs regulate MOV10 expression and L1 retrotransposition in mESCs.

-
AScheme and quantification of relative luminescence from luciferase assays validating posttranscriptional regulation of MOV10 by miRNAs in HEK293T cells (n = 4 biological replicates).
-
BScheme and quantification of relative luminescence from luciferase assays in Hek293T cells to confirm specificity of posttranscriptional regulation of MOV10 by miRNAs with either wild‐type (WT) or mutant (MUT) reporters where the MicroRNA response element (MRE) for the depicted miRNAs in the 3'UTR of MOV10 were mutated (n = 3 biological replicates).
-
CScheme and representative images for western blot analysis and corresponding quantification to assess miRNA‐mediated regulation on MOV10 expression in mESCs (n = 3 biological replicates).
-
DScheme and representative images from colony‐forming assays for plasmid‐based retrotransposition analysis where miRNA‐mediated downregulation of MOV10 in Drosha_KO mESCs is accompanied by an increase in L1 retrotransposition (n = 3 biological replicates).
Data information: In (A–D), bar graphs represent mean ± SD, P‐value determined using ordinary one‐way ANOVA test ****P‐value < 0.0001, ***P‐value < 0.001, **P‐value < 0.005, *P‐value < 0.05.
Source data are available online for this figure.
