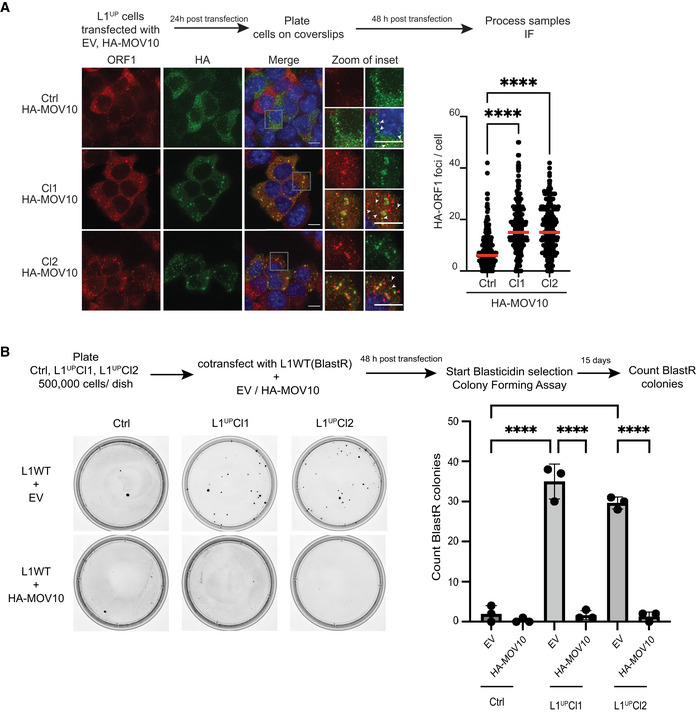
Figure 5. MOV10 upregulation is sufficient to create L1 RNP aggregates in L1UP mESCs abrogating L1 retrotransposition.

-
AScheme of experiment and representative images along with quantitation showing induction of L1 RNP aggregate formation upon ectopic MOV10 expression. Images are maximum intensity projections across Z stacks from indicated mESCs stained for L1 ORF1p (red) combined with immunostaining for HA (green) to detect ectopically expressed MOV10 tagged with HA, and nuclei stained with DAPI (blue). White arrow heads point to cytoplasmic foci where L1 ORF1p and HA‐MOV10 co‐localize. Data collected from 289 Ctrl, 275 L1UP Cl1, and 296 L1UP Cl2 mESCs (n = 3 biological replicates).
-
BScheme and representative images from colony‐forming assays for plasmid‐based retrotransposition analysis in Ctrl and L1UP mESCs comparing rate of retrotransposition upon transfection with Empty Vector (EV) or ectopic expression of HA‐MOV10 (n = 3 biological replicates).
Data information: In (A) scatter plots where circles are single data points representing number of co‐localized HA‐ORF1 foci in the cytoplasm per cell. Red bar marks median for the distribution. P‐value was determined using Mann–Whitney U test and **** represent P‐value < 0.0001. In (B) bar graphs represent mean ± SD, P‐value determined using ordinary one‐way ANOVA test ****P‐value < 0.0001.
Source data are available online for this figure.
