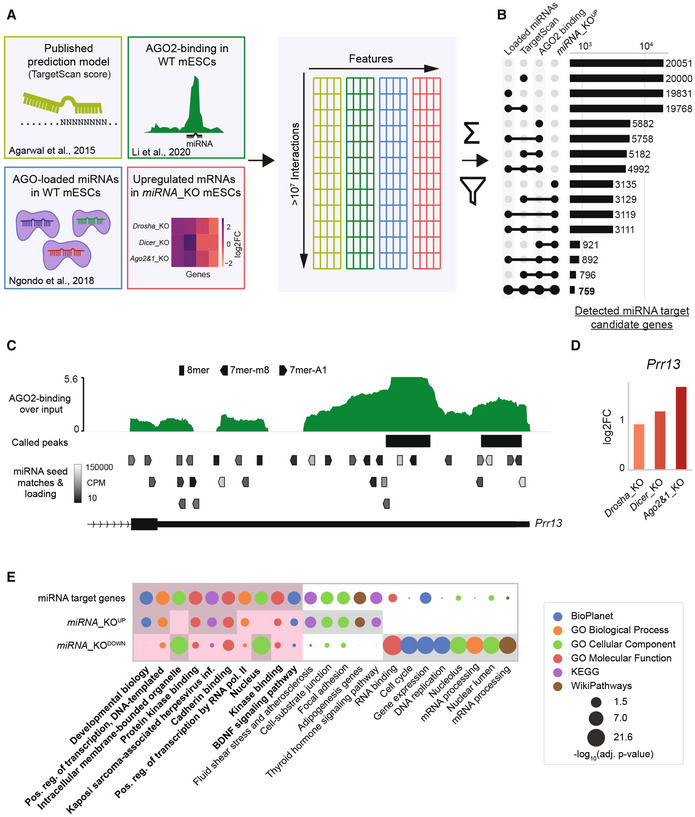
Figure 1. Multi‐OMICs integration allows the identification of functional miRNA interactions in mESCs.

-
AGraphical overview of data sources and integration. Data are integrated on a per‐interaction basis, filtered by miRNA loading into Argonaute complexes (AGOs), AGO2‐binding, target upregulation and sequence‐based predictions and then scored on a per‐interaction and per‐gene basis (see Materials and Methods). Scoring allows for a confidence ranking of interactions and target genes.
-
BNumber of identified functional miRNA target genes for different integrative filtering approaches. The integration and filtering by mutant upregulation, AGO2‐binding, and TargetScan data leads to a restrictive selection of predicted target genes.
-
C, DExample of integrated data for the Prr13 gene with multiple lines of evidence for functional miRNA interactions. (C) shows AGO2‐binding profile and called peaks as obtained from (Li et al, 2020), along with predicted miRNA binding sites with the AGOs‐loading of the corresponding miRNA in WT mESCs (only binding sites for miRNAs with minimal expression of 10 CPM are shown). (D) shows the misregulation of Prr13 in miRNA_KO mutants (2 biological replicates each) in log2FoldChanges (log2FC) compared to WT.
-
EGO term analysis of gene sets representing miRNA target genes (759), commonly up‐ (3609), and downregulated (2956) genes. Top eight statistically most significant terms for each of the three gene groups are shown and highlighted with a gray background. Red background highlights the comparison of the top terms from miRNA target genes set.
Data Information: miRNA_KOUP and miRNA_KODOWN genes were determined by an adjusted P‐value threshold of 0.2 (DESeq2) in at least two miRNA_KO lines. Statistical significance for GO terms was determined by Enrichr and is indicated in the figure.
