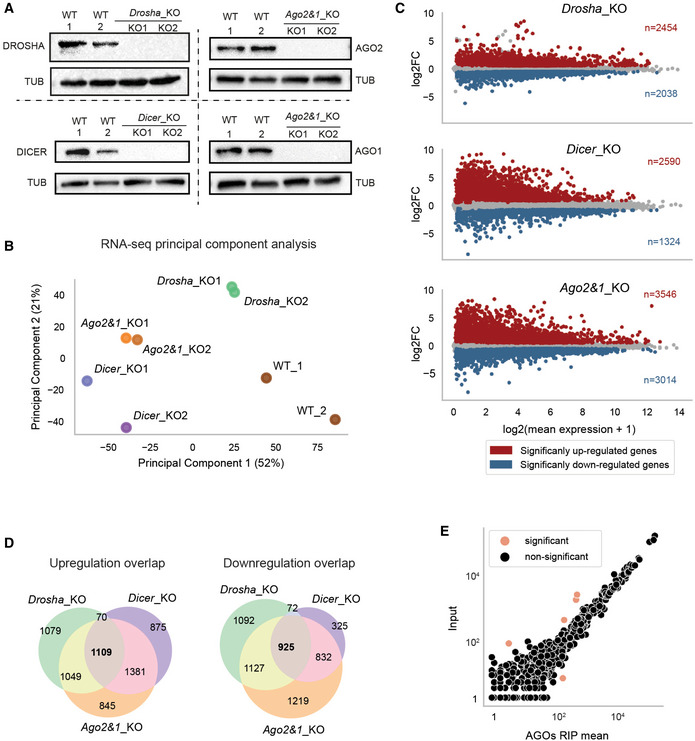
Figure EV1. Gene expression is globally perturbed in miRNA_KO mESCs.

- Immunoblot analysis of DROSHA, DICER, AGO1, and AGO2 in WT and their respective KO mESC lines. TUBULIN was used as a loading control. Representative blot of three independent experiments is shown.
- PCA of gene expression as measured by RNA sequencing in miRNA_KO and WT samples. Biological replicates are indicated with corresponding colors.
- MA plots of the DGE analysis in miRNA_KO mutants versus WT. Significant up‐ and downregulated genes are colored in red and blue, respectively.
- Overlap of up‐ (left) and downregulated (right) genes in miRNA_KO mESCs.
- Comparison of miRNA loading for small RNA sequencing (Input) versus Argonaute2 & 1 (AGOs) RNA immunoprecipitation (RIP) and sequencing for all miRNAs. MiRNAs that show statistically significant difference between the two measured (adjusted P‐value < 0.1) are highlighted.
Data information: In (C and E), significance in differential analysis was determined using an adjusted P‐value threshold obtained from DESeq2 of 0.1. In (D), an adjusted P‐value threshold of 0.2 was applied.
Source data are available online for this figure.
