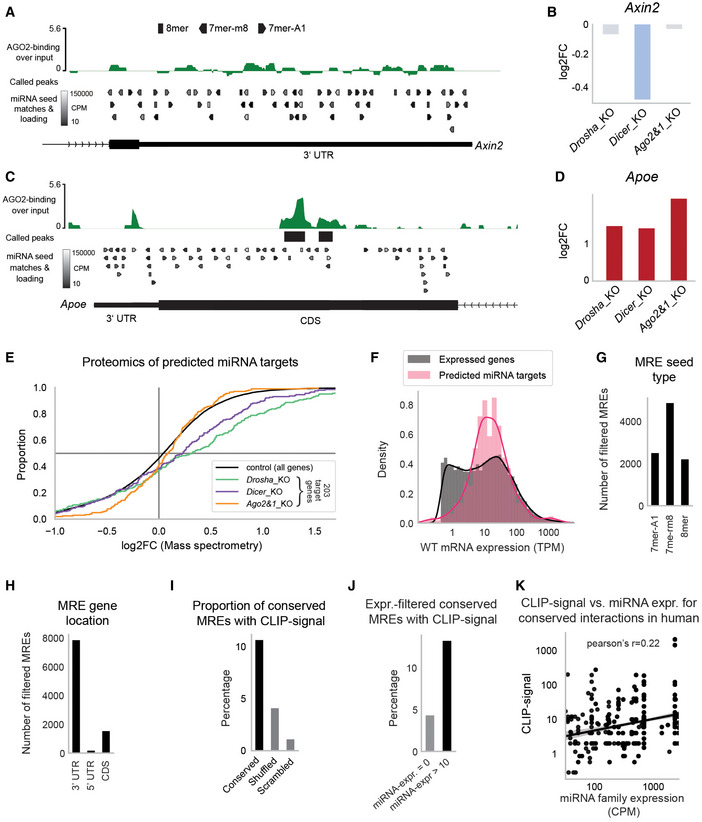
Figure EV2. Characterization of predicted miRNA interactions.

-
A, BExample of integrated data for the Axin2 gene with no evidence for functional interactions. For a more detailed subplot description, refer to the figure legend of Fig 1C and D.
-
C, DNo statistically significant AGO2‐binding in 3′UTR of the Apoe gene, yet statistically significant binding to the CDS at a strongly expressed 8mer binding site along with a consistent upregulation in all three mutants. For a more detailed subplot description, refer to the figure legend of Fig 1C and D.
-
ECumulative distribution function of differential protein abundance as detected by SWAT‐MS in miRNA_KO mESCs. Of 759 predicted miRNA target genes, 203 (27%) were detectable in the SWATH‐MS data and appear in the plot.
-
FExpression distribution of predicted miRNA targets in comparison to expression of all genes (filtered by TPM >0.5 to improve comparability).
-
GNumber of filtered (see Fig 1A and B) miRNA response elements (MREs) grouped by the three most effective seed types 7mer‐A1, 7mer‐m8, and 8mer.
-
HNumber of filtered (see Fig 1A and B) MREs grouped by their location within the messenger RNA (3′UTR, 5′UTR, and CDS).
-
IConservation analysis of predicted interactions in hESCs. An interaction is considered conserved if a miRNA seed matching MRE is found in the 3′UTR of the human ortholog gene. Shown is the proportion of mESC‐predicted interactions that have conserved MREs with associated cross‐linking immunoprecipitation (CLIP)‐seq reads in hESCs. As control, MRE search in hESCs was performed with shuffled and scrambled miRNA sequences.
-
JSimilar to (I), but only interactions with miRNA expression above 10 CPM (and = 0 CPM for control) were considered. miRNA expression was evaluated on a per‐family basis, corresponding to the seed‐match binding logic.
-
KCorrelation of hESC miRNA expression with the number of CLIP‐seq reads in hESCs for human‐conserved interactions (see Fig EV2I). Only interactions with at least one CLIP‐seq read and at least 10 CPM miRNA expression are considered. miRNA expression is shown on a family basis (expression of miRNAs with the same seed is summed).
Data information: In (E), Student's t‐test was applied to determine the significance of increased protein abundance for 203/759 miRNA targets (P < 0.0051 for every mutant). In (K), Pearson correlation was calculated, P < 1e−50.
Source data are available online for this figure.
