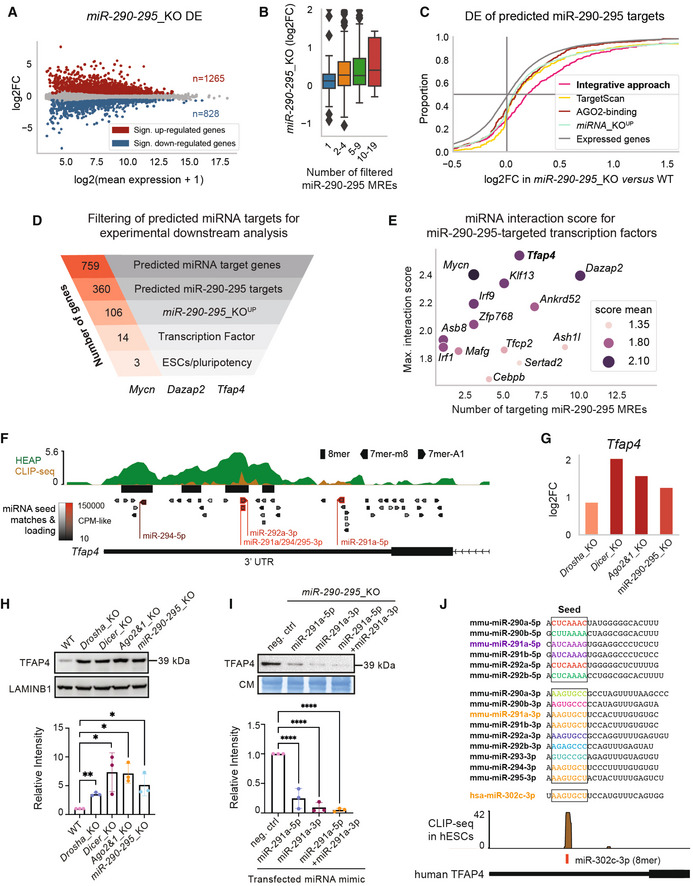
Figure 3. Validation of predicted miRNA targets.

-
AMA plot of the DGE analysis in miR‐290‐295_KO mESCs.
-
BDE of predicted miR‐290‐295 target genes in miR‐290‐295_KO versus WT for genes grouped by number of filtered miR‐290‐295 MREs/interactions (similar to Fig 2C).
-
CCumulative distribution function of DE in miR‐290‐295_KO for different gene groups. Colored log2FoldChange (log2FC) distributions correspond to different identification methods for miR‐290‐295 target genes based on different datasets (Fig 1A). Integrative approach refers to the 360 miR‐290‐295‐targeted genes out of the 759 candidate miRNA target genes that have been identified in the integrative analysis of this paper (Fig 1A). TargetScan targets were filtered for three strongly expressed members of the miR‐290‐295 cluster and from these the top 360 (in terms of TargetScan/context++ score) are shown. AGO2‐binding targets were first filtered by seed matches to the same three strongly expressed miR‐290‐295 members, then the 360 targets with the strongest binding signals were selected. miRNA_KO‐upregulated genes are the 3609 miRNA_KO UP genes used in the integrative analysis (see Materials and Methods section).
-
DFunnel analysis representing the number of genes identified by the integrative approach in each indicated category ending with miR‐290‐295 regulated transcription factors previously implicated in stem cell functions and pluripotency in the scientific literature.
-
EInteraction scores from our integrative analysis (Fig 1A) for all transcription factors predicted to be targeted by miR‐290‐295. The number of distinct miRNA binding sites for the miR‐290‐295 cluster, mean of interaction score, and maximum of interaction score is shown.
-
F, GIntegrated data for Tfap4 gene show multiple lines of evidence for its regulation by miR‐290‐295. In addition to the data shown and described in Fig 1C and D, a second AGO2‐binding dataset, based on cross‐linking immunoprecipitation and sequencing (CLIP‐seq), has been integrated. Response elements for miR‐290‐295 cluster members are denoted in red and labeled.
-
HTop: Immunoblot analysis of TFAP4 in WT, Drosha_KO, Dicer_KO, Ago2&1_KO, and miR‐290‐295_KO mESCs. LAMINB1 was used as a loading control. Blot is a representative image of three biological replicates. Bottom: Bar graph showing quantification of CIC intensity, normalized to LAMINB1 and relative to the WT sample in three biological replicates.
-
ITop: Immunoblot analysis of TFAP4 after transfection of miRNA mimics (miR‐291a‐5p, miR‐291a‐3p and miR‐291a‐5p + miR‐291a‐3p combined) in miR‐290‐295_KO mESCs. Immunoblots were stained with Coomassie blue dye as a loading control. Blot is a representative image of three biological replicates. Bottom: Bar graph showing quantification of TFAP4 intensity, normalized to Coomassie and relative to the WT sample in three biological replicates.
-
JTop: Mature sequences of 5p and 3p miRNAs of the miR‐290‐295 family and the mature sequence of the human miR‐302c‐3p. Colors indicate identical seed sequences. Bottom: AGO2 CLIP‐seq shows a peak at the miR‐302c‐3p binding site on human TFAP4.
Data information: In (A), significant genes in MA plot were determined using an adjusted P‐value of 0.1. In H and I, bar graphs show mean intensity of TFAP4 signal ± SD normalized to LAMINB1 or Coomassie. Values are relative to WT or the negative control mimic, which was set to 1. P‐values were calculated using a Student's t‐test comparing each value to the WT. *P‐value < 0.05, **P‐value < 0.01, ****P‐value < 0.0001. Box plot in panel (B) follows the same specification as described in Fig 2B and D. The sizes of the presented groups are 97, 164, 89, 10 (from left to right).
Source data are available online for this figure.
