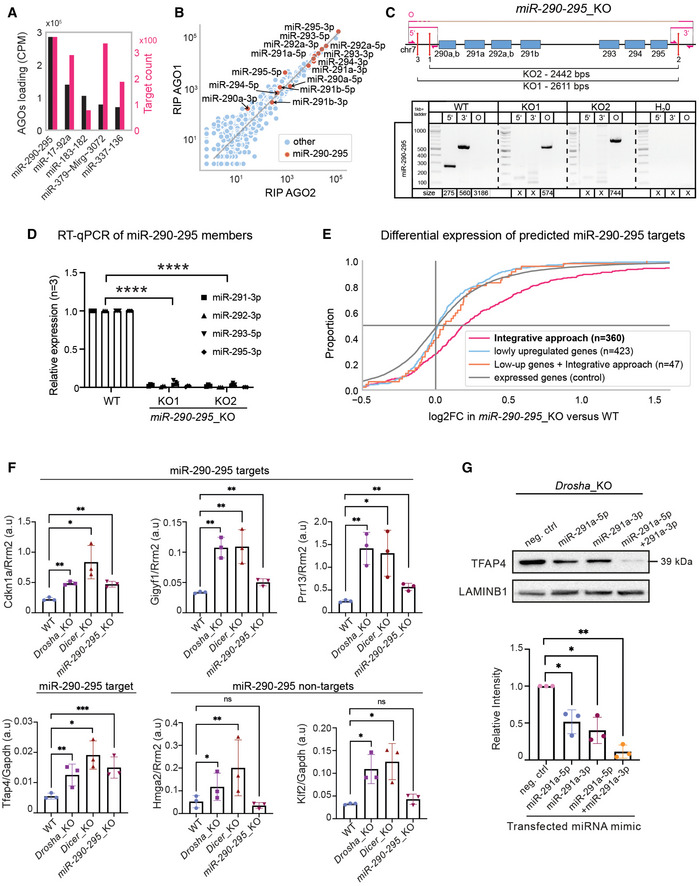
Figure EV3. Validation of predicted miRNA targets.

- MiRNA loading in Argonaute2 &1 (AGOs) and number of predicted target counts for top five loaded miRNA clusters.
- Loading of miRNAs in AGOs, highlighting miR‐290‐295 cluster members.
- MiR‐290‐295_KO strategy and genomic validation. Top: Schematic representation of the paired CRISPR/Cas9 KO approach for the generation of miR‐290‐295_KO cluster mESC lines. Genomic loci of miRNAs are indicated by blue boxes. Red lines mark sgRNA target sites. Primers for screening of the genomic deletion are indicated by pink half‐sided arrows and pink lines show PCR products. Bottom: Genomic PCR screening of miR‐290‐295_KO mESCs. Three screening primers, one around the 5′ cut site, one around the 3′ cut site, and one around the entire KO region (O) were used, as annotated at the top part of the subfigure. Expected amplicon sizes are denoted below the lanes. An X denotes no expected product.
- Quantitative real‐time PCR for representative miR‐290‐295 members in WT and miR‐290‐295_KO mESC lines. Expression levels were normalized to RNU6 in three biological replicates.
- Cumulative distribution function of differential expression in miR‐290‐295_KO for different gene groups, similar to Fig 3B. Colored log2FoldChange (log2FC) distributions correspond to different identification methods for miR‐290‐295 target genes based on different datasets (see Materials and Methods section). Integrative approach refers to the 360 miR‐290‐295‐targeted genes out of the 759 miRNA target genes that have been identified in the integrative analysis of this paper (Fig 1A). Lowly upregulated genes are those that show a log2FC between 0.1 and 0.5 in all three mutants. Low‐up genes + integrative filtering used the same set of genes but filtered for AGO2‐binding to one of three strongly expressed miR‐290‐295 members.
- Quantitative real‐time PCR showing relative expression levels of four predicted miR‐290‐295 targets and two miR‐290‐295 non‐targets normalized to the control genes Rrm2 or Gapdh in Drosha_KO Dicer_KO and miR‐290‐295_KO mESCs.
- Immunoblot analysis of TFAP4 after transfection of miRNA mimics (miR‐291a‐5p, miR‐291a‐3p and miR‐291a‐5p + miR‐291a‐3p combined) in Drosha_KO mESCs. LAMINB1 was used as a loading control. Blot is a representative image of three biological replicates. Bottom: Bar graph showing quantification of TFAP4 intensity, normalized to LAMINB1 and relative to the WT sample in three biological replicates.
Data information: In (D), statistical significance for RT‐qPCR of miR‐290‐295 members was assessed using a 2‐way ANOVA test. ****P < 0.0001. In (F), RT‐qPCR bar graphs show relative expression of miR‐290‐295 targets and non‐targets based on arbitrary units and normalized to a housekeeping gene (Rrm2 or Gapdh) for three biological replicates. P‐values were generated using a t‐test comparing each value to the WT. *P‐value < 0.05, **P‐value < 0.01, and ***P‐value < 0.001. In G, bar graphs show mean intensity of TFAP4 signal ± SD normalized to LAMINB1. Values are relative to the negative control mimic, which was set to 1. P‐values were calculated using a Student's t‐test comparing each value to the WT. *P‐value < 0.05, **P‐value < 0.01.
Source data are available online for this figure.
