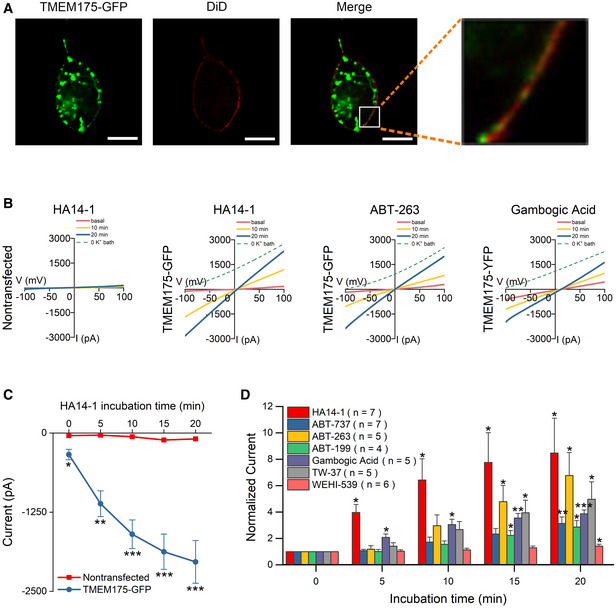
Figure 1. Inhibitors selective for Bcl‐2 family proteins activate TMEM175 currents.

-
ACo‐localization of green fluorescent protein (GFP)‐tagged TMEM175 (TMEM175‐GFP) and the plasma membrane (PM) marker DiD in HEK293T cells. Scale bars = 10 μm.
-
BRepresentative whole‐cell currents recorded at different time points after application of the Bcl‐2‐selective inhibitors HA14‐1 in nontransfected HEK293T cells and HA14‐1, ABT‐263, and gambogic acid in TMEM175‐GFP‐transfected HEK293T cells. The currents were recorded with ramp protocols (−100 to +100 mV in 1 s, every 10 s, Vh = 0 mV).
-
CCurrent amplitudes measured at −100 mV in the ramp protocol used in (B). n = 5 for nontransfected group. n = 7 for TMEM175‐GFP group.
-
DCurrent amplitudes (at −100 mV) measured at different time points after the application of Bcl‐2‐targeting agents normalized to the basal value (0 min). The HA14‐1 data are replotted from (C) for comparison.
Data information: The data are presented as the mean ± SEM. Statistical significance was analyzed using post hoc tests with analysis of variance (ANOVA) (C) or calculated with two‐sided Student's t‐tests (D), and is indicated with * for P < 0.05, ** for P < 0.01, and *** for P < 0.001. n value means the number of biological replicates made for each data point.
