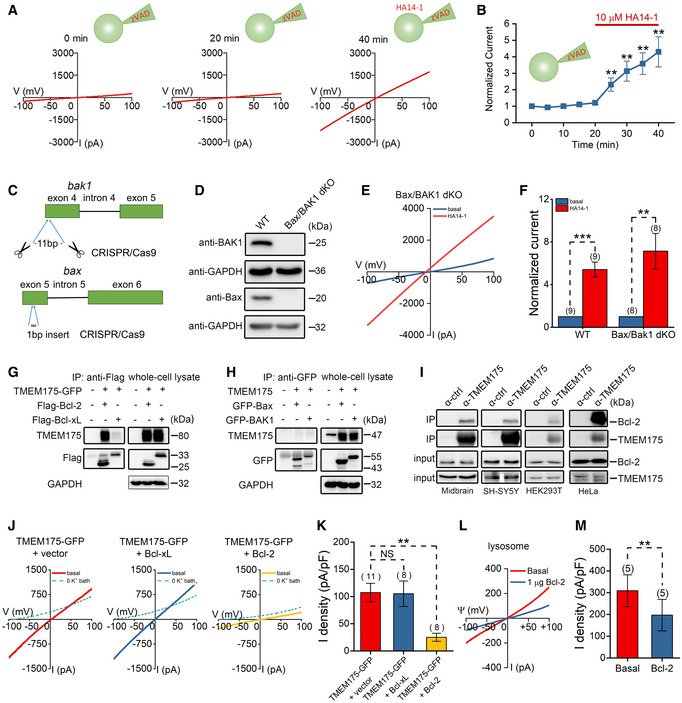
Figure 2. Bcl‐2 binds to and regulates TMEM175 through caspase‐independent way.

-
ARepresentative current traces recorded with the pan‐caspase inhibitor Z‐VAD‐FMK (zVAD; carbobenzoxy‐valyl‐alanyl‐aspartyl‐[O‐methyl]‐fluoromethylketone) at a concentration of 10 μM in pipette solution. The basal currents were recorded for 20 min, and then 10 μM HA14‐1 was added to the bath solution.
-
BCurrent amplitudes (at −100 mV) normalized to the basal values (0 min). The red solid line indicates the time frame for HA14‐1 application. n = 8.
-
CSchematic diagram showing the double knockout (dKO) strategy of Bax/BAK1 in HEK293T cells.
-
DBax/BAK1 protein levels were detected by Western blotting.
-
ERepresentative TMEM175 whole‐cell currents recorded in Bax/BAK1 double knockout (dKO) cells overexpressing TMEM175 with 10 μM HA14‐1 bath application.
-
FCurrent amplitudes measured at −100 mV at 20 min after application of HA14‐1 normalized to the basal value (0 min).
-
G, HResults of immunoblotting with immunoprecipitates (IPs) or whole‐cell lysates from HEK293T cells transfected with different constructs as indicated.
-
IImmublotting results with IP or input (whole‐cell lysates) from mouse midbrain, SH‐SY5Y, HEK293T, or HeLa cells as indicated. The α‐ctrl represents that the magnetic beads used in IP were not preincubated with any antibody.
-
JRepresentative TMEM175 whole‐cell currents recorded in HEK293T cells expressing TMEM175 co‐transfected or not co‐transfected with Bcl‐2.
-
KStatistics of the current densities in (J).
-
LRepresentative TMEM175 lysosomal currents recorded in HEK293T cells expressing TMEM175 with or without Bcl‐2 application in bath solution.
-
MStatistics of the current densities in (L).
Data information: The data are presented as the mean ± SEM. Statistical significance was calculated with two‐sided Student's t‐test, and is indicated with NS for not significant (P > 0.05), ** for P < 0.01, and *** for P < 0.001. n value means the number of biological replicates made for each data point.
