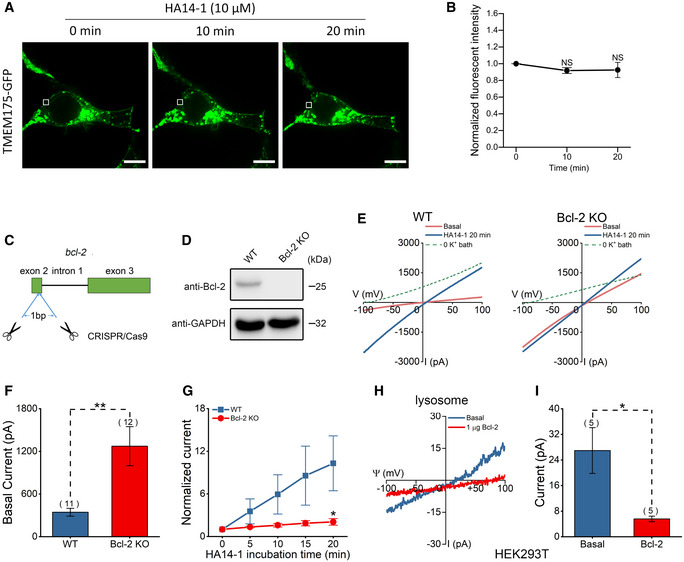
Figure EV2. HA14‐1 activates TMEM175 through Bcl‐2 without inducing translocation of TMEM175 to the plasma membrane (PM).

-
ALocalization of C‐terminally green fluorescent protein (GFP)‐tagged TMEM175 before (0 min) and after incubation with HA14‐1; 10 and 20 min are the incubation times. The white boxes indicate TMEM175‐expressing PM regions. Scale bars = 10 μm.
-
BFluorescence intensities of selected PM regions indicating the expression of TMEM175. n = 4 (four PM regions selected from different cells in the same experiment).
-
CSchematic diagram showing the knockout (KO) strategy of Bcl‐2 in HEK293T cells.
-
DThe knockout (KO) of Bcl‐2 protein was detected by Western blotting.
-
ERepresentative whole‐cell currents recorded in wild‐type (WT) (left) and Bcl‐2 KO (right) HEK293T cells transfected with TMEM175 at 0 min (basal) and 20 min after bath application of 10 μM HA14‐1. The currents were recorded with ramp protocols (−100 to +100 mV in 1 s, every 10 s, Vh = 0 mV).
-
FAmplitudes of basal currents measured at −100 mV in the ramp protocol used in (E).
-
GCurrent amplitudes measured at different time points after the application of HA14‐1 normalized to the basal values (0 min).
-
HRepresentative endogenous TMEM175 lysosomal currents recorded in HEK293T cells with or without 1 μg Bcl‐2 application in bath solution.
-
IStatistics of the currents in (H).
Data information: The data are presented as the mean ± SEM. Statistical significance was analyzed with two‐sided Student's t‐tests, and is indicated with NS for not significant (P > 0.05), and * for P < 0.05, ** for P < 0.01. In panel (B), n value means the number of technical replicates. In other panels, n value means the number of biological replicates made for each data point.
