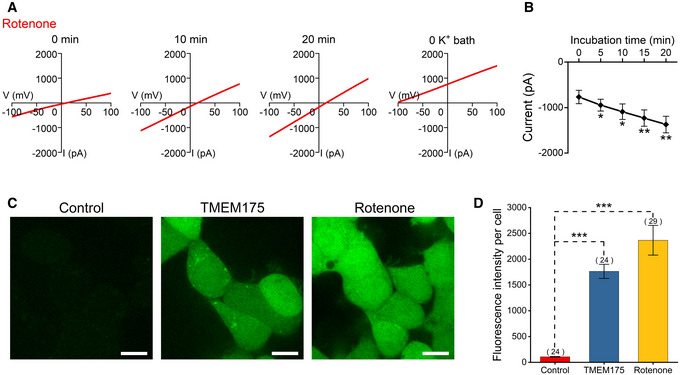
Figure EV4. Activation of TMEM175 by rotenone.

-
ARepresentative current traces showing the effects of 10 μM rotenone in the bath solution.
-
BQuantification of the current amplitudes measured at −100 mV in the ramp protocol used in (A). n = 8.
-
CCM‐H2DCFDA (5‐(and‐6)‐chloromethyl‐2'‐7'‐dichlorodihydrofluorescein diacetate) (green) indicating cellular reactive oxygen species (ROS) levels of HEK293T cells overexpressing TMEM175 or pretreatment of 10 μM rotenone for 1 h. Scale bars = 10 μm.
-
DStatistics of CM‐H2DCFDA fluorescence intensity of (C). The n values represent the cell number counted within the same experiment.
Data information: The data are presented as the mean ± SEM. Statistical significance was analyzed with two‐sided Student's t‐tests, and is indicated with * for P < 0.05, ** for P < 0.01, and *** for P < 0.001. In panel (B), n value means the number of biological replicates made for each data point. In panel (D), n value means the number of technical replicates.
