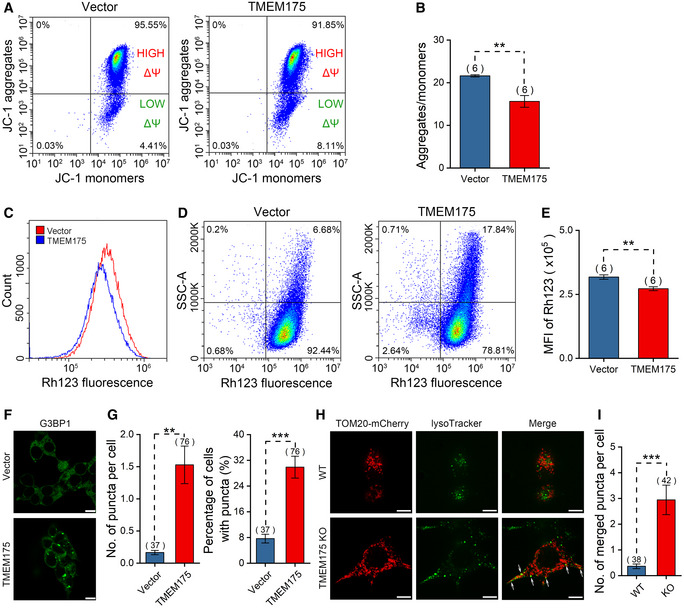
Figure 5. TMEM175 overexpression impairs mitochondrial membrane potential and mitophagy in HEK293T cells.

-
AFlow cytometric analysis of JC‐1 staining in HEK293T cells transfected with mock vector or TMEM175. Horizontal axis and vertical axis represent fluorescence intensities of JC‐1 monomers and JC‐1 aggregates, respectively.
-
BStatistics of the ratios of JC‐1 aggregates/monomers in (A).
-
CFlow cytometric analysis of Rhodamine 123 staining in HEK293T cells transfected with mock vector or TMEM175.
-
DRhodamine 123 fluorescence of cells in (C) is plotted against side scatter signal (SSC).
-
EStatistics of Rhodamine123 mean fluorescence intensities in (C).
-
FFluorescence of G3BP1 (Ras‐GTPase‐activating protein (GAP)‐binding protein 1) excited with 488 nm in control (upper) and TMEM175‐overexpressing (lower) cells. Scale bars = 10 μm.
-
GStatistics of the numbers of puncta per cell (left) and the percentage of cells with puncta in (F). We counted 547 cells in Vector group from 37 different fields of view and 332 cells in TMEM175 group from 76 different fields of view. n value represents the number of different fields of view randomly selected in the same imaging experiment.
-
HCo‐localization of mitochondrial indicator TOM20‐mCherry and lysosomal indicator LysoTracker in WT (upper row) or TMEM175 KO (lower row) HEK293T cells. Co‐localization of mitochondrion and lysosome is observed as a yellow color in the merged image (marked by white arrows). Scale bars = 10 μm.
-
IThe number of merged puncta per cell in (H). We counted 139 cells in wild‐type (WT) group from 38 different fields of view and 148 cells in TMEM175 KO group from 42 different fields of view. n value represents the number of different fields of view randomly selected in the same imaging experiment.
Data information: The data are presented as the mean ± SEM. Statistical significance was calculated with two‐sided Student's t‐test, and is indicated with ** for P < 0.01, and *** for P < 0.001. In panels (G and I), n value means the number of technical replicates. In other panels, n value means the number of biological replicates made for each data point.
