-
A
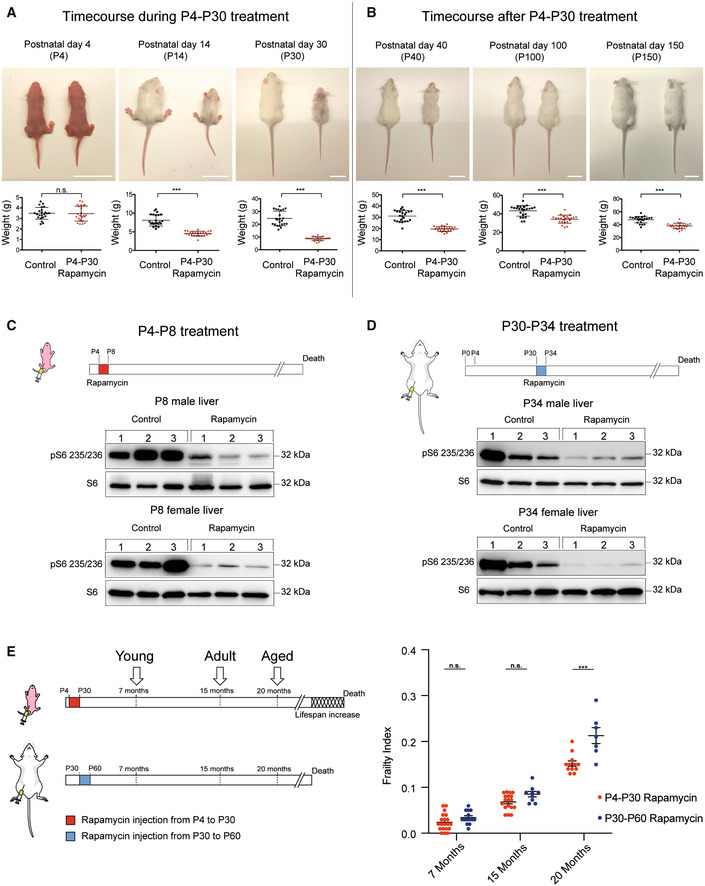
Upper panels: Representative pictures showing rapamycin effects on mouse body size during P4‐P30 treatment. Images of n = 23 biological replicates (both for control and for rapamycin‐treated mice) have been taken at P4, P14, and P30 (end of the treatment). Scale bar: 3 cm. Lower panels: Scatter dot plot indicating body weight of control and rapamycin‐treated mice during P4‐P30 treatment. Data are indicated as mean + SD. Two‐tailed Student's t‐test; ***P < 0.0005, n.s., not significant.
-
B
Upper panels: Representative pictures showing rapamycin effects on mouse body size after P4‐P30 treatment. Images of n = 23 biological replicates (both for control and for rapamycin‐treated mice) have been taken at P40, P100, and P150. Scale bar: 3 cm. Lower panels: Scatter dot plot indicating body weight of control and P4‐P30 rapamycin‐treated mice after the treatment. Data are indicated as mean + SD. Two‐tailed Student's t‐test; ***P < 0.0005, n.s., not significant.
-
C, D
Upper part, schematic illustration of the experimental procedure. Western blot analysis of S6 ribosomal protein and phospho‐S6 ribosomal protein (Ser235/236) from whole‐liver protein extracts of female and male at P8 (C) and P34 (D) rapamycin‐treated mice. Mice were sampled after 4 days of EtOH or rapamycin treatment.
-
E
Schematic illustration of the different time points analyzed (left side) and Frailty Index box (right side) of P4‐P30 and P30‐P60 rapamycin‐treated mice. Red scatter dots indicate the Frailty Index of P4‐P30 rapamycin‐treated mice at 7 months (n = 20; biological replicates), 15 months (n = 18; biological replicates), and 20 months (n = 12; biological replicates). Blue scatter dots indicate the Frailty Index of P30‐P60 rapamycin‐treated mice at 7 months (n = 14; biological replicates), 15 months (n = 9; biological replicates), and 20 months (n = 7; biological replicates). Data are indicated as mean + SEM. Two‐way ANOVA; ***P < 0.0005, n.s., not significant.

