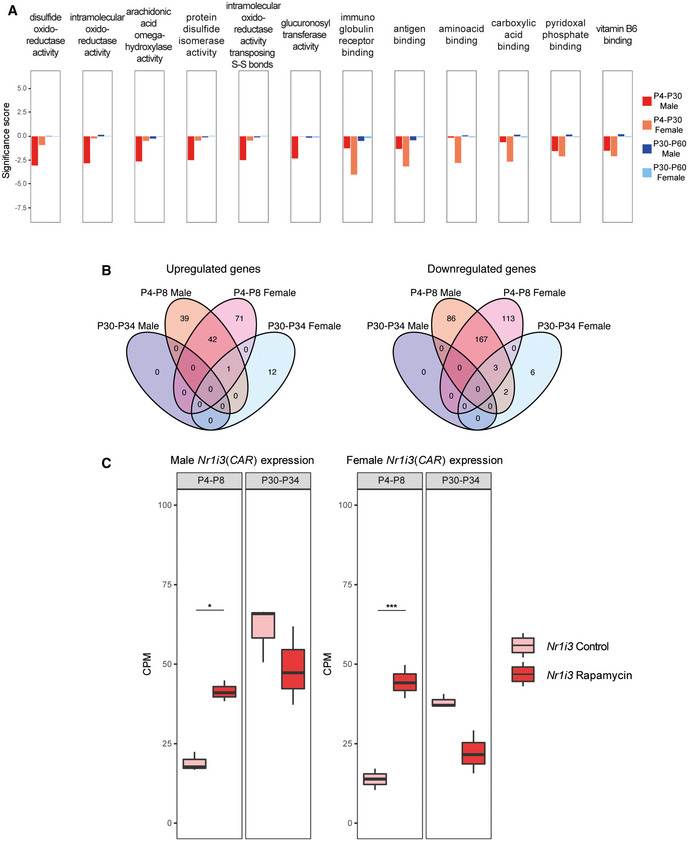
Figure EV2. RNA‐seq analysis of acute rapamycin treatments (P4‐P8 and P30‐P34).

-
AGene Set Enrichment Analysis (GSEA) results of P4‐P30 and P30‐P60 treatments in male and female mice. Significance score, calculated as log10 (q‐value) corrected by the sign of regulation, is plotted on the y‐axis. The whole list of enriched GO terms is available in Dataset EV4.
-
BLandscape of up‐ and downregulated genes across the P4‐P8 and P30‐P34 treatments in male and female mice. Venn diagrams are used to highlight private and shared differentially expressed genes.
-
CExpression profile of Nr1i3 (CAR) gene across P4‐P8 and P30‐P34 male (left side) and female (right side) rapamycin‐treated mice. Values in treated and control samples across the different conditions are shown as median CPM with bars representing standard deviations across the biological replicates. Data distribution is presented through boxplots, where the central bar represents the median, while the lower and upper hinges correspond to the first and third quartiles (the 25th and 75th percentiles). The upper/lower whisker extends from the hinge to the largest/smallest value no further than 1.5 * IQR from the hinge (where IQR is the interquartile range, or distance between the first and third quartiles). P‐values were generated by the edgeR DEG analysis, detailed in the Methods. *P < 0.05, ***P < 0.0005, n.s., not significant.
