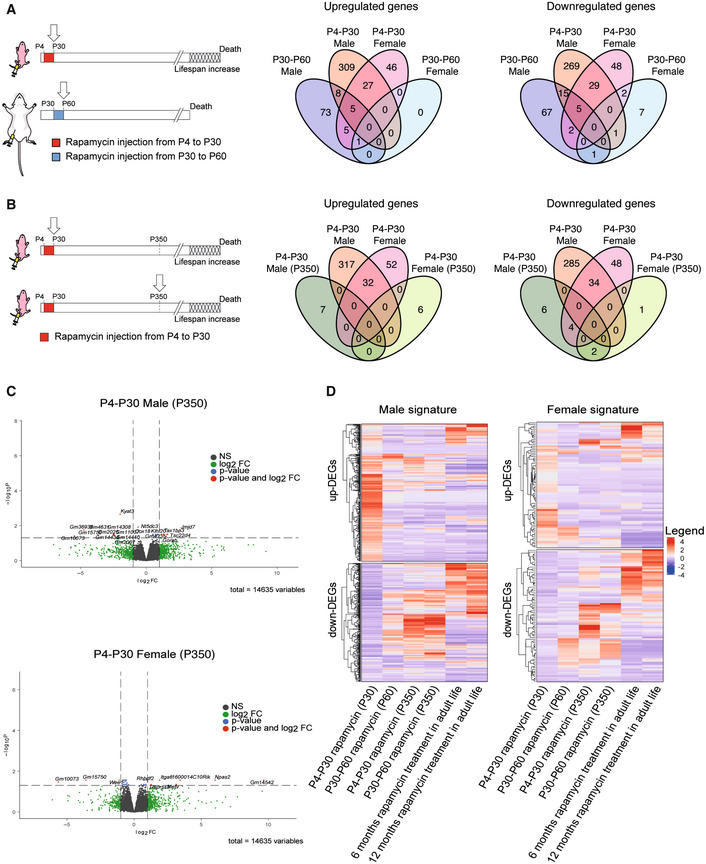
Figure 3. RNA‐seq analysis on P4‐P30 rapamycin‐treated mice resulted in a unique transcriptional signature.

-
ASchematic illustration of the experimental procedures (left). Landscape of up‐ and downregulated genes across P4‐P30 and P30‐P60 treatments in male and female mice. Venn diagrams are used to highlight private and shared differentially expressed genes.
-
BSchematic illustration of the experimental procedures (left). Landscape of up‐ and downregulated genes across P4‐P30 treatment processed at the last day of treatment and at P350 in male and female mice. Venn diagrams are used to highlight private and shared differentially expressed genes.
-
CVolcano plots showing the transcriptional changes in P4‐P30 rapamycin‐treated male (upper panel) and female (lower panel) mice processed at P350. The log2FC is represented on the x‐axis. The y‐axis shows the −log10 of the corrected P‐value. A P‐value of 0.05 and log2FC of 1 and −1 are indicated by gray lines. Top 10 upregulated and top 10 downregulated genes (when available) are labeled with gene symbols.
-
DLog2FC of genes that are differentially expressed only in male (left side) and female (right side) in response to P4‐P30 treatment at the last day of treatment is compared, through heatmaps, with corresponding log2FC profiles in: P30‐P60 on the last day of treatment; P4‐P30 and P30‐P60 treatment analyzed at P350; and published data on chronic rapamycin treatment in adult life (6 and 12 months; Tyshkovskiy et al, 2019).
