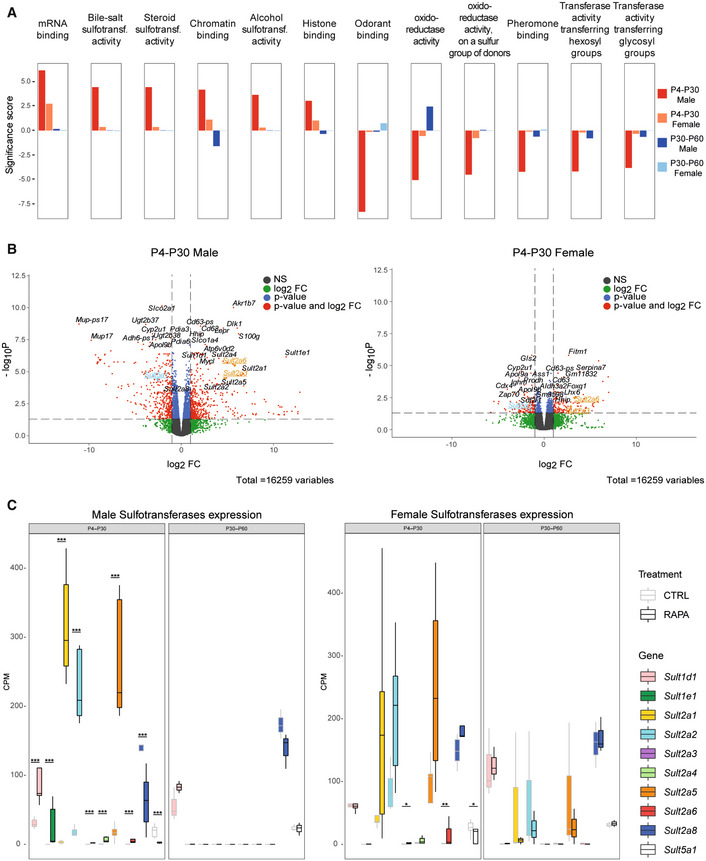
Figure 4. Functional enrichment analysis indicates sulfotransferase activity as a pathway involved in lifespan regulation.

-
AGene Set Enrichment Analysis (GSEA) results of P4‐P30 and P30‐P60 at the last day of treatment in male and female mice. Significance score, calculated as ‐log10(q‐value) corrected by the sign of regulation, is plotted on the y‐axis. Plots are representative of the top 12 GO Molecular Function (MF) terms with higher/lower significance scores for the male P4‐P30 rapamycin‐treated mice (top 6 with higher significance scores and top 6 with lower significance scores). The whole list of enriched GO terms is available in Dataset EV4.
-
BVolcano plots showing the transcriptional changes in P4‐P30 rapamycin‐treated male (left side) and female (right side) mice. Each circle represents a gene. Underlined and highlighted terms are common SULT genes shared by males and females (orange for upregulated genes, blue for downregulated genes). The log2FC is represented on the x‐axis. The y‐axis shows the −log10 of the corrected P‐value. A P‐value of 0.05 and log2FC of 1 and −1 are indicated by gray lines. Top 10 upregulated and top 10 downregulated genes are labeled with gene symbols.
-
CExpression profile of sulfotransferases deregulated only in the P4‐P30 time window in male (left side) and female (right side) rapamycin‐treated mice. Values for treated (dark borders) and control (light borders) samples across the different conditions are shown as median CPM with bars representing standard deviations across the five biological replicates. P‐values were generated by the edgeR DEG analysis, detailed in the Methods. *P < 0.05, **P < 0.005, and ***P < 0.0005.
