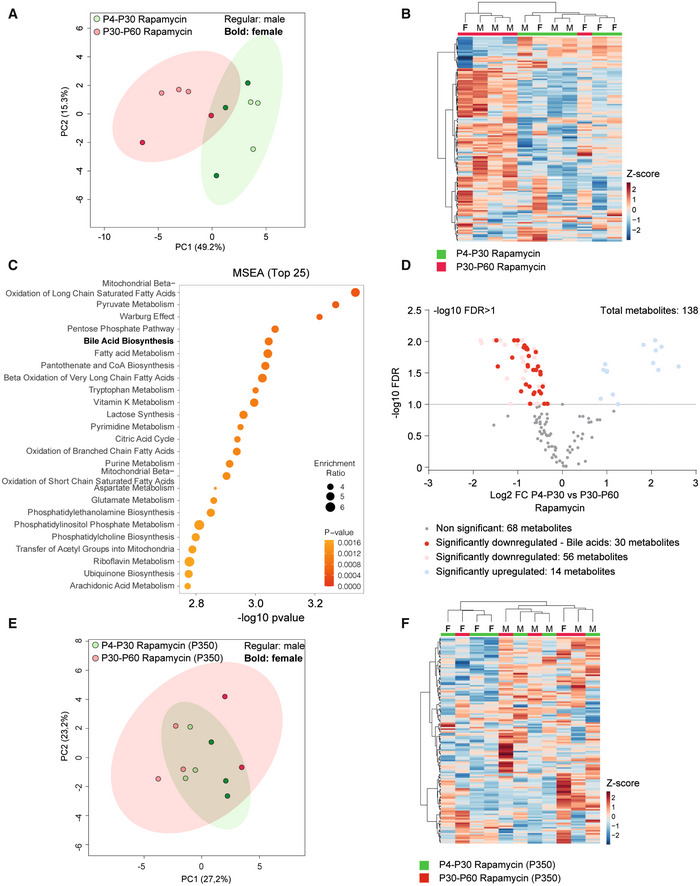
Figure 5. Early‐transient treatment with rapamycin increases bile acid liver detoxification in mice.

-
A, BPrincipal component analysis (PCA) (A) and heatmap (B) of liver metabolomic profile from P4‐P30 (green samples) and P30‐P60 (red samples) mice treated with rapamycin.
-
CTop 25 metabolic pathways enriched in P4‐P30 compared with P30‐P60 mice treated with rapamycin. Metabolic Set Enrichment Analysis (MSEA) was performed taking advantage of MetaboAnalyst 5.0 webtool interrogating the KEGG database. The x‐axis shows the −log10 of P‐value.
-
DVolcano plots showing the metabolomic changes in P4‐P30 compared with P30‐P60 mice treated with rapamycin. Each circle represents one metabolite. The log2 fold change is represented on the x‐axis. The y‐axis shows the −log10 of the false discovery rate (FDR). A FDR of 0.1 is indicated by gray line. Gray, pink, and light blue dots represent unchanged, significantly downregulated, and significantly upregulated metabolites, respectively. Red dots represent significantly downregulated bile acids in P4‐P30 compared with P30‐P60 mice treated with rapamycin.
-
E, FPrincipal component analysis (PCA) (E) and heatmap (F) of liver metabolomic profile from P4‐P30 (green samples) and P30‐P60 (red samples) mice transiently treated with rapamycin and analyzed at P350. F, female; M, male.
