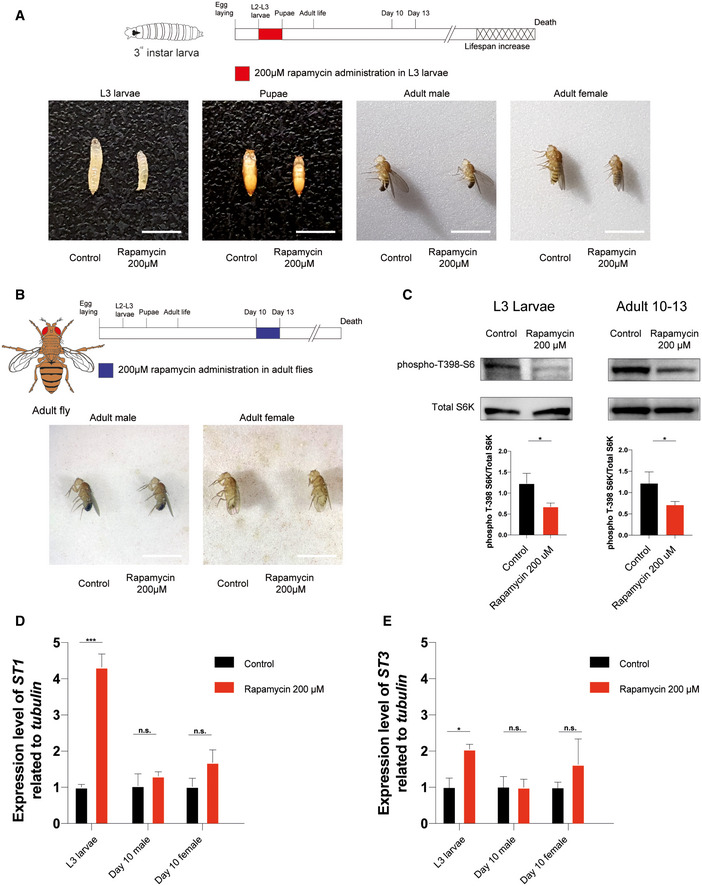
Figure EV5. Physical status and biochemical effectiveness of rapamycin treatment in w iso31 Drosophila melanogaster .

-
ARepresentative images showing rapamycin effects on Drosophila body size during and after treatment on third‐instar (L3) larvae. Images acquired during L3 larvae (120 h after egg laying), pupae, and adult (1 day post‐eclosion) stages. Scale bar: 3 mm.
-
BRepresentative images showing rapamycin effects on Drosophila body size after treatment on 10‐day‐old flies. Images acquired during adult stage (3 days post‐treatment). Scale bar: 3 mm.
-
CWestern blot analysis and quantification of S6 ribosomal protein and phospho‐T398‐S6 ribosomal protein on whole‐fly protein extracts of L3 larvae (left side) and 10‐day‐old flies treated for 3 days (right side). Two‐tailed Student's t‐test; *P < 0.05.
-
D, EGene expression analysis via qRT–PCR of dST1(A) and dST3(B) in three biological replicates of w iso31 L3 wandering larvae (n = 30 per biological replicate) and 10‐day‐old flies (n = 10 per biological replicate) treated with 200 μM rapamycin, 12 h after treatment. Data are indicated as mean + SEM. Two‐tailed Student's t‐test; *P < 0.05, ***P < 0.0005, n.s., not significant.
