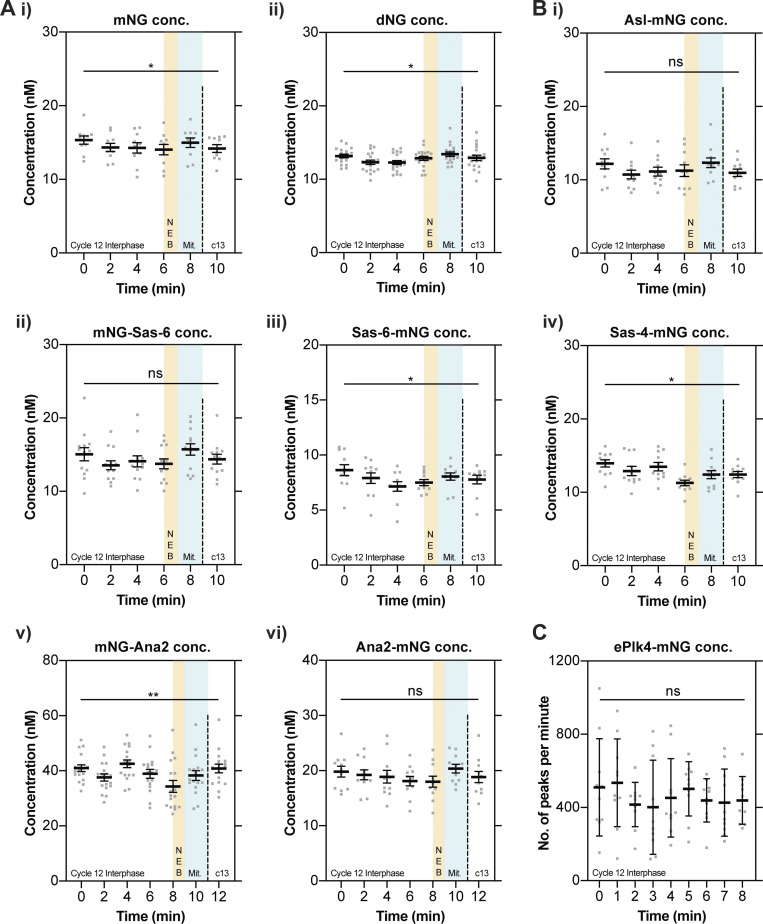
Figure 2.
The cytoplasmic concentration of the core centriole duplication proteins does not change dramatically as daughter centrioles assemble during nuclear cycle 12. (A and B) Graphs show cytoplasmic FCS concentration measurements (mean ± SEM) of either mNG or dNG controls (A) or mNG-fusions to the core centriole duplication proteins (B). Measurements were taken every 2 min from the start of nuclear cycle 12. The timing window of NEB is depicted in yellow and mitosis in green. Each data point represents the average of 4–6× 10-s recordings from an individual embryo (N ≥ 10). (C) The graph shows ePlk4-mNG PeCoS measurements (mean ± SD) taken at 60-s intervals from the start of nuclear cycle 12. Each data point represents an individual 60 s PeCoS measurement (N = 10). Statistical significance was assessed using a paired one-way ANOVA test (for Gaussian-distributed data) or a Friedman test (**, P < 0.01; *, P < 0.05).

