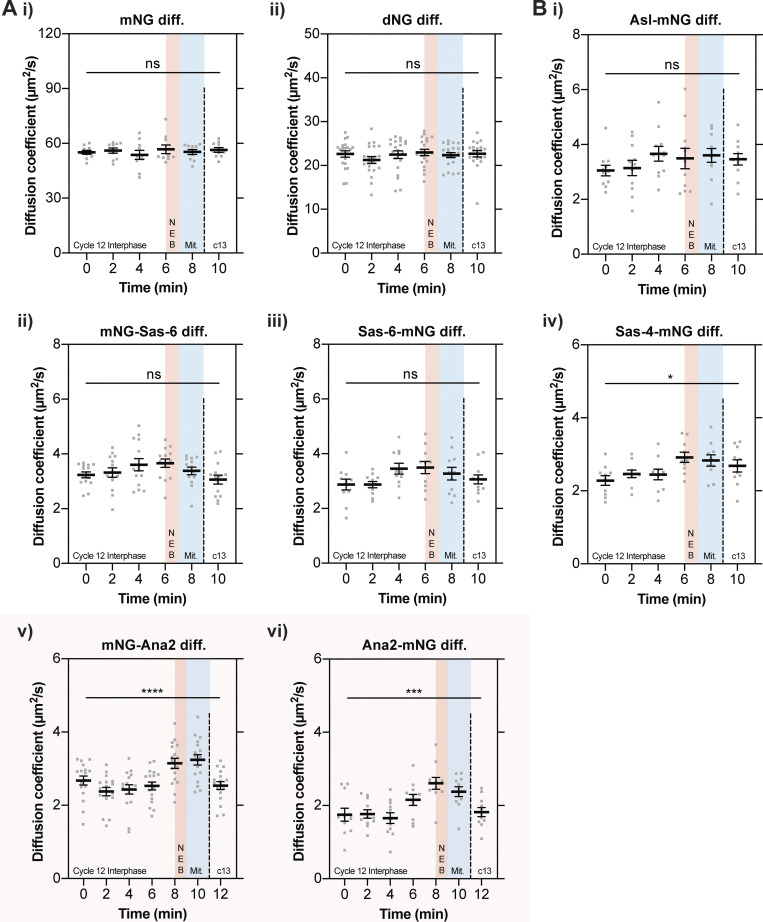
Figure 3.
The cytoplasmic diffusion rate of Ana2 changes significantly as embryos exit S-phase. (A and B) Graphs show cytoplasmic FCS diffusion rate measurements (mean ± SEM) of either mNG or dNG controls (A) or mNG-fusions to the core centriole duplication proteins (B). Measurements were taken every 2 min from the start of nuclear cycle 12. The timing window of NEB is depicted in red, and of mitosis in blue. Each data point represents the average of 4–6× 10-s recordings from an individual embryo (N ≥ 10). The mNG-Ana2 and Ana2-mNG graphs are boxed in pink, as these proteins showed the most dramatic change in diffusion rates during the cycle. Statistical significance was assessed using a paired one-way ANOVA test (for Gaussian-distributed data) or a Friedman test (****, P < 0.0001; ***, P < 0.001; *, P < 0.05).

