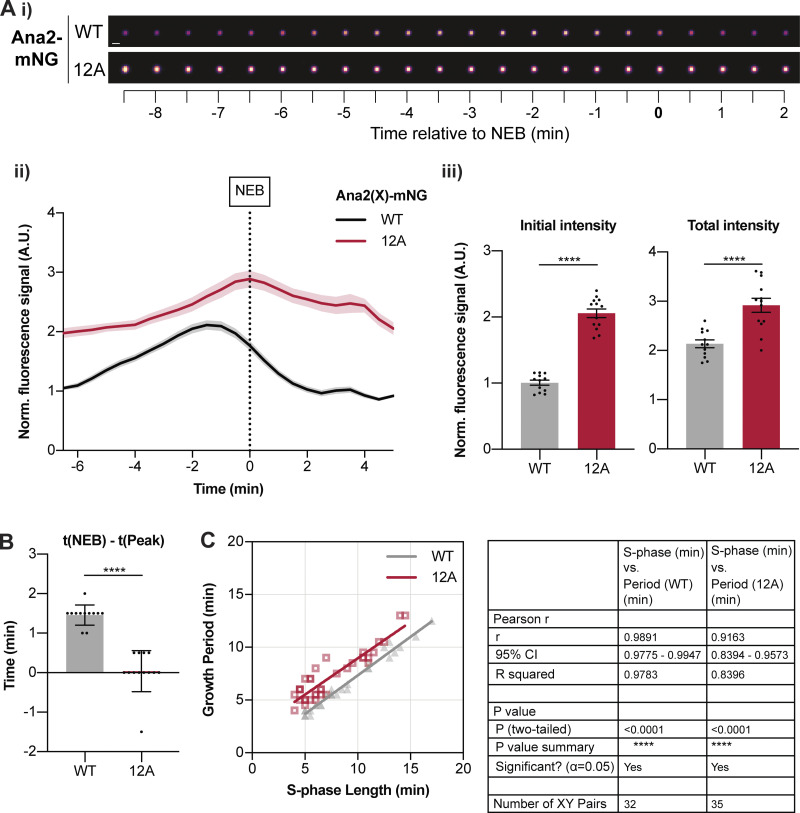
Figure 5.
eAna2(12A)-mNG exhibits an abnormal pattern of centriolar recruitment. (A i) Images show the typical centriolar recruitment dynamics of WT Ana2-mNG or eAna2(12A)-mNG in an embryo during nuclear cycle 12—aligned to nuclear envelope breakdown (NEB; t = 0). Images were obtained by superimposing all the centrioles at each time point and averaging their fluorescence (scale bar = 1 µm). (ii) Graph shows the normalized (mean ± SEM) centriolar fluorescence levels of WT Ana2-mNG (black) and eAna2(12A)-mNG (red) during nuclear cycle 12 aligned to nuclear envelope breakdown (NEB; t = 0). N > 12 embryos; n ∼ 100–150 centriole pairs per embryo. (iii) Bar charts quantify the normalised initial and maximal centriolar intensity (mean ± SEM). Each data point represents the average value of all centrioles measured in an individual embryo. (B) Quantification of the time (mean ± SD) at which Ana2 levels start to decrease at the centriole relative to NEB/mitosis. Statistical significance was assessed using an unpaired t test with Welch’s correction (for Gaussian-distributed data) or a Mann-Whitney test (****, P < 0.0001). (C) Scatterplot shows the correlation (obtained by linear regression of the data) between Ana2’s growth period and S-phase length during nuclear cycles 11–13. N ≥ 10 embryos for each cycle, n ∼ 70–90 (c11), n ∼ 100–150 (c12), and n ∼ 200–300 (c13) centriole pairs per embryo. Correlation strength was assessed using the Pearson’s correlation coefficient.

