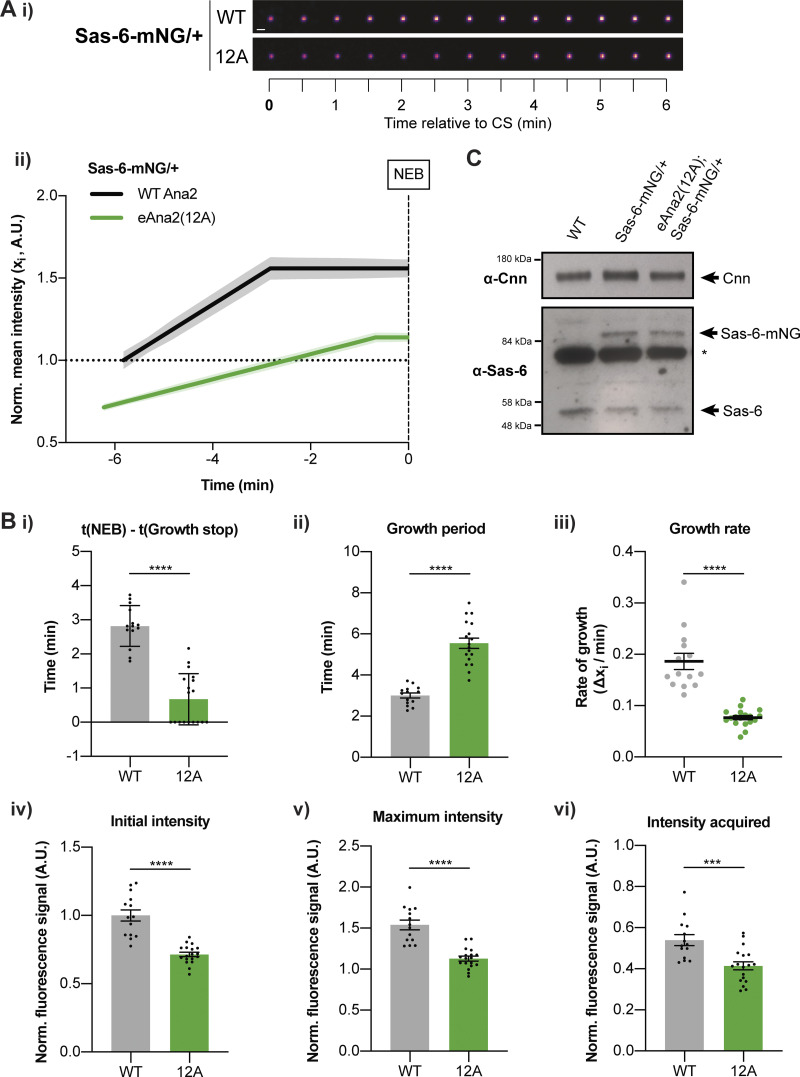
Figure 6.
Centrioles grow more slowly, but for a longer period, in the presence of eAna2(12A). (A i) Images show the typical centriolar recruitment dynamics of Sas-6-mNG in a WT embryo or an embryo expressing eAna2(12A) during nuclear cycle 12—aligned to centriole separation at the start of S-phase (CS; t = 0). Images were obtained by superimposing all the centrioles at each time point and averaging their fluorescence (scale bar = 1 µm). (ii) Graph shows the normalized (mean ± SEM) Sas-6-mNG centriole recruitment dynamics during nuclear cycle 12 in the presence of WT Ana2 (black) and eAna2(12A) (green) aligned to nuclear envelope breakdown (NEB; t = 0). N > 14 embryos, n ∼ 100–150 centriole pairs per embryo. (B) Bar charts quantify and compare several centriole growth parameters (mean ± SEM) extracted from the data shown in (A ii). The values were derived from the fitted regression curve of the mean Sas-6-mNG intensity of each individual embryo. Each datapoint represents the average value of all the centriole pairs measured in each embryo. Statistical significance was assessed using an unpaired t test with Welch’s correction (****, P < 0.0001; ***, P < 0.001). (C) Western blot shows Sas-6 levels in WT embryos and embryos expressing one copy of Sas-6-mNG in either a WT or eAna2(12A) background. A prominent non-specific band is highlighted (*); Cnn is shown as loading control. A representative blot is shown from two technical repeats.

