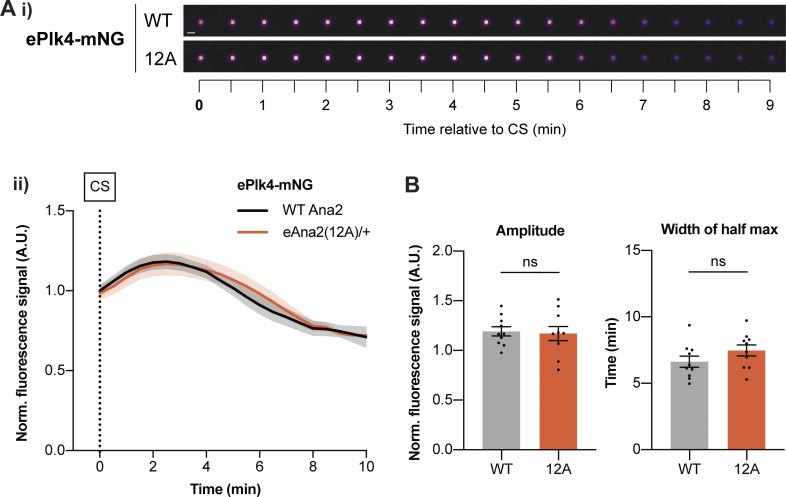
Figure 7.
The centriolar Plk4 oscillation is not dramatically perturbed in the presence of eAna2(12A). (A i) Images show the typical centriolar recruitment dynamics of ePlk4-mNG in a WT embryo or an embryo expressing one copy of untagged eAna2(12A) in the presence of one copy of the endogenous WT ana2 gene during nuclear cycle 12—aligned to centriole separation at the start of S-phase (CS; t = 0). Images were obtained by superimposing all the centrioles at each time point and averaging their fluorescence (scale bar = 1 µm). (ii) Graph shows the normalized (mean ± SEM) centriolar recruitment dynamics of ePlk4-mNG in the presence of either only untagged endogenous Ana2 (black) or one copy of untagged eAna2(12A) expressed in the presence of one copy of the endogenous WT ana2 gene (orange) during nuclear cycle 12. Data was aligned to centriole separation (CS) at the start of S-phase. N = 10 embryos, n ∼ 100 centriole pairs per embryo. (B) Bar charts quantify the amplitude (maximal intensity) and period (full width at half maximum intensity) (mean ± SEM) of the Plk4-mNG oscillation. Each data point represents the average value of all the centrioles measured in an individual embryo. Statistical significance was assessed using an unpaired t test with Welch’s correction.

