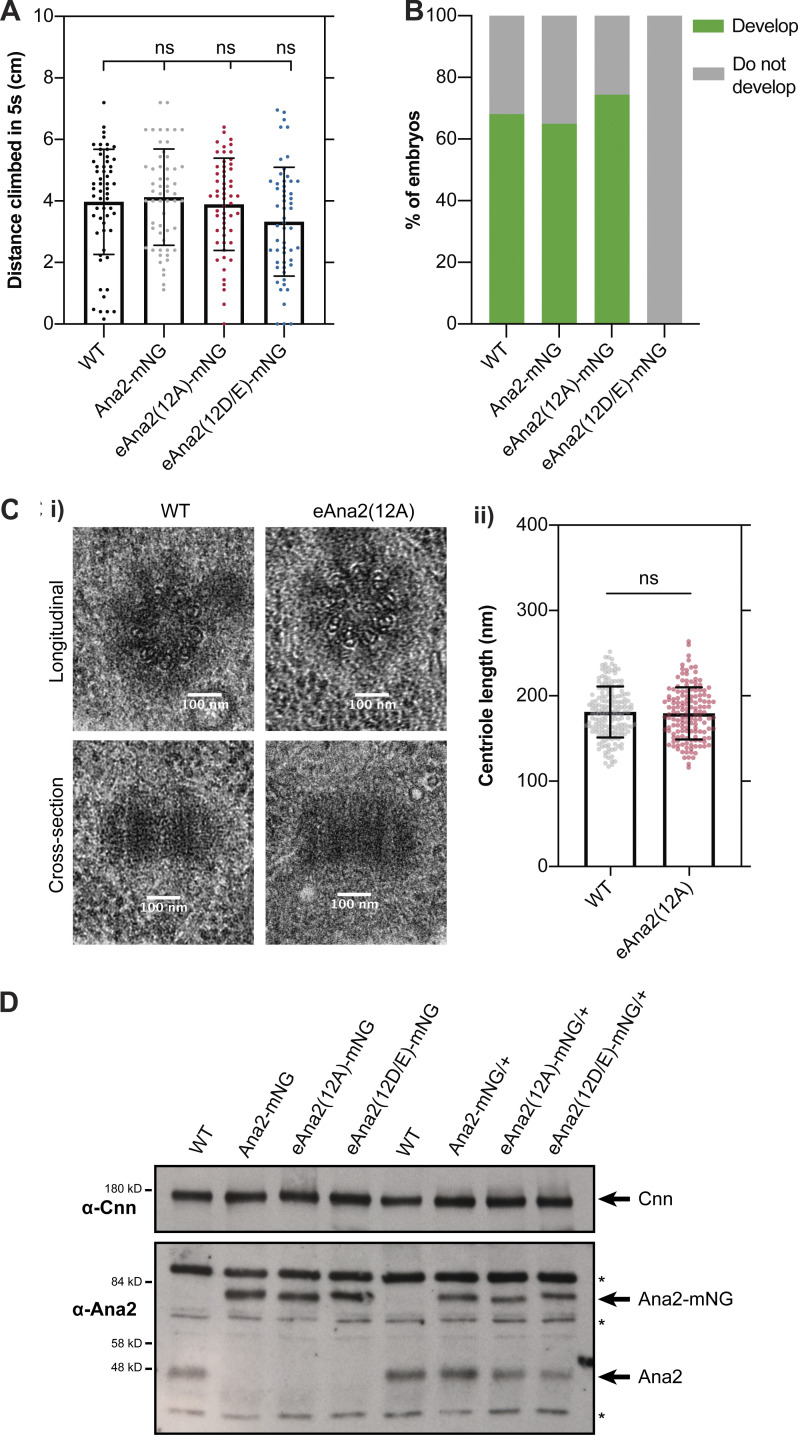
Figure S5.
The Ana2(12A) mutant appears to fully rescue the ana2−/− mutant phenotype. (A) Graphs quantify the distance climbed by WT or ana2−/− mutant flies expressing either WT Ana2-mNG, eAna2(12A)-mNG or eAna2(12D/E)-mNG in the 5 s period after all the flies have been mechanically “banged” to the bottom of a vial. This is a standard assay to measure fly coordination. Note that ana2−/− mutant flies are completely uncoordinated, so they cannot climb any distance at all. All three alleles, WT, 12A and 12D/E rescue this phenotype, suggesting that centriole duplication and cilia formation are unperturbed in these “rescued” flies. Each individual point on the graph represents the average distance climbed by a single fly in an individual experiment. 10–15 flies were measured in 4–6 technical repeats for each genotype. Statistical significance was assessed using an unpaired t test with Welch’s correction. (B) Graph quantifies the percentage of embryos that hatch as larvae when laid by either WT females or ana2−/− mutant females expressing either WT Ana2-mNG, eAna2(12A)-mNG or eAna2(12D/E)-mNG. Note that these experiments were conducted when the laboratory was experiencing a general problem with Fly food, whereby many of our laboratory strains were laying embryos that did not hatch at their normal high frequencies (usually >85% for WT controls); ∼400 embryos were counted for each genotype. (C i) EM Images show exemplar centrioles in either WT or ana2−/− mutant expressing eAna2(12A) 3rd instar larval wing discs. We examined a total of ∼150 centrioles from five wing-discs of each genotype and identified no obvious morphological defects. (ii) Graph shows centriole length—scored blind in longitudinal EM sections, as depicted in the bottom panels in C (i)—in ana2−/− mutant 3rd instar larval wing discs expressing either WT Ana2 or eAna2(12A). Statistical significance was assessed using an unpaired t test with Welch’s correction. (D) Western blots of 0–2 h embryos comparing the expression levels of Ana2-mNG, eAna2(12A)-mNG and eAna2(12D/E)-mNG. Prominent non-specific bands are highlighted (*). Cnn is shown as a loading control, and a representative blot is shown from at least two technical repeats.

