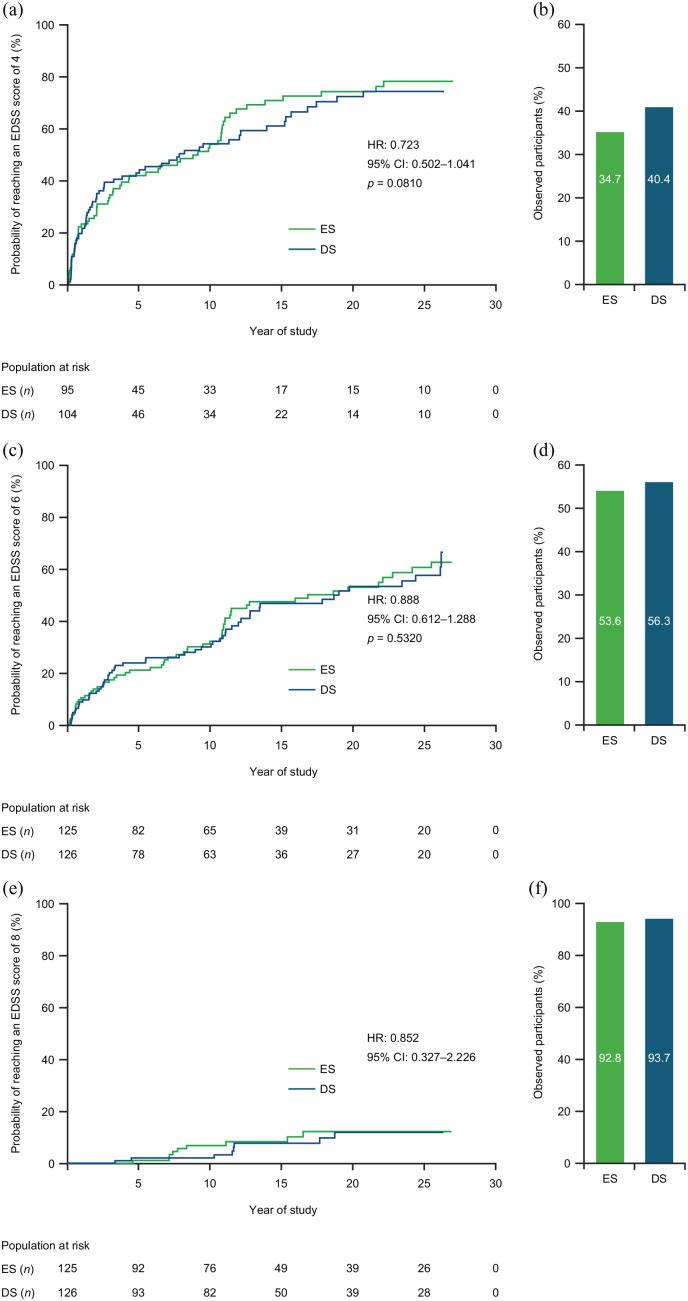
Figure 2.
Time-to-EDSS score and proportion of participants not reaching an EDSS score of (a and b) 4, (c and d) 6, or (e and f) 8.
Kaplan–Meier curves. HR, CI, and p values are from the Cox proportional hazards model. CI: confidence interval; EDSS: Expanded Disability Status Scale; ES: early start; DS: delayed start; HR: hazard ratio.

