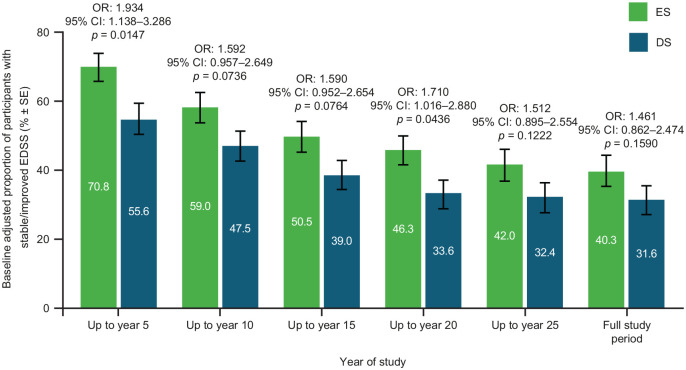
Figure 3.
Proportion of participants with stable/improved EDSS by treatment group.
Stable/improved EDSS scores were defined as up to a 0.5-point increase from baseline, worsened EDSS scores were defined as a > 0.5 increase from baseline. Bars display percentage estimates ±SEs. OR, 95% CI and p values are from logistic regression model results; covariates used were baseline EDSS score and log of the number of relapses in the 2 years prior to study. CI: confidence interval; EDSS: Expanded Disability Status Scale; ES: early start; DS: delayed start; OR: odds ratio.

